Lithuanian vs Bangladeshi In Labor Force | Age 16-19
COMPARE
Lithuanian
Bangladeshi
In Labor Force | Age 16-19
In Labor Force | Age 16-19 Comparison
Lithuanians
Bangladeshis
40.4%
IN LABOR FORCE | AGE 16-19
100.0/ 100
METRIC RATING
57th/ 347
METRIC RANK
42.5%
IN LABOR FORCE | AGE 16-19
100.0/ 100
METRIC RATING
24th/ 347
METRIC RANK
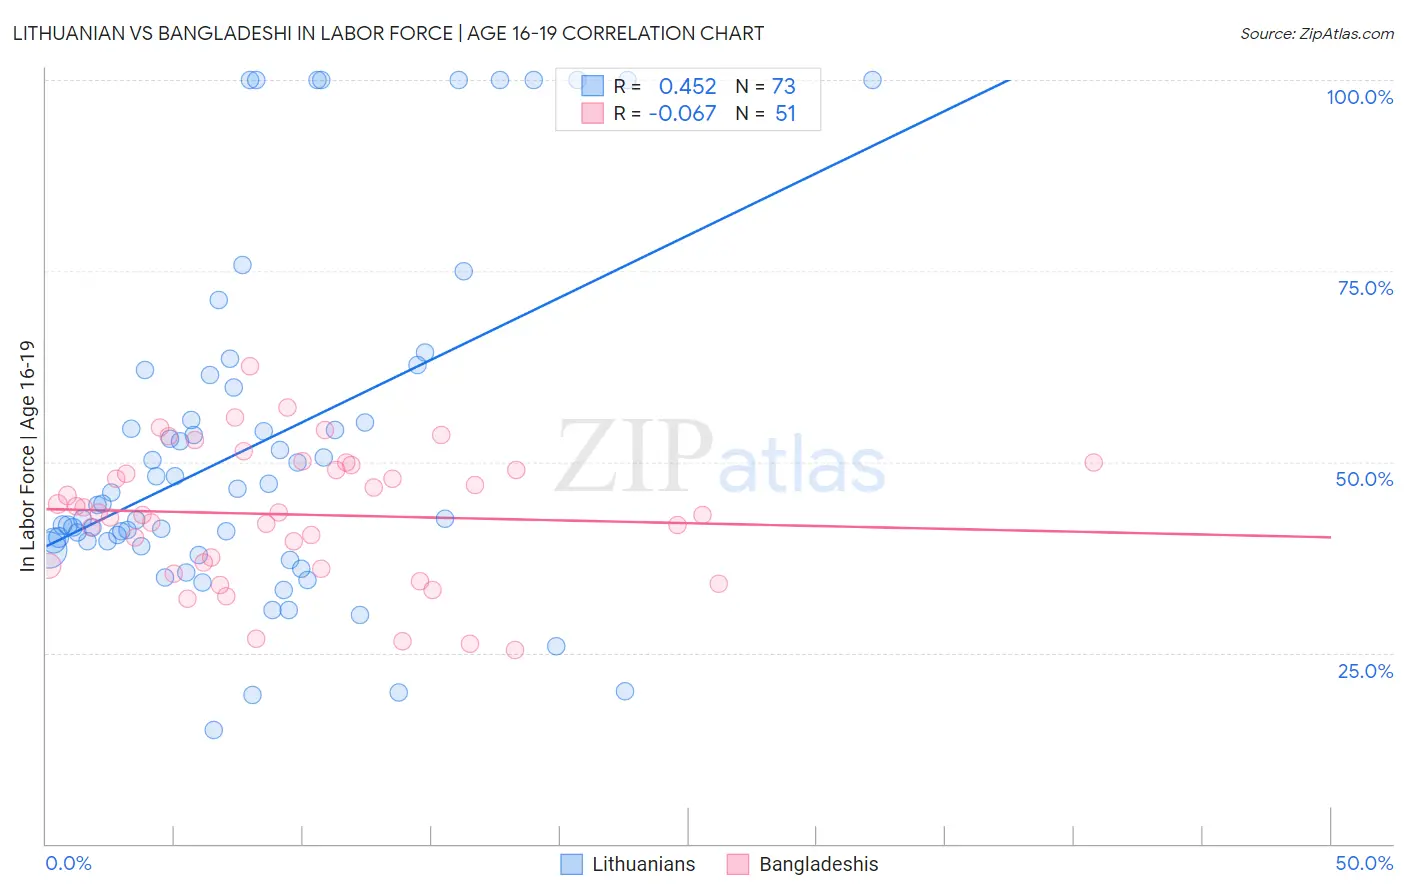
Lithuanian vs Bangladeshi In Labor Force | Age 16-19 Correlation Chart
The statistical analysis conducted on geographies consisting of 420,922,487 people shows a moderate positive correlation between the proportion of Lithuanians and labor force participation rate among population between the ages 16 and 19 in the United States with a correlation coefficient (R) of 0.452 and weighted average of 40.4%. Similarly, the statistical analysis conducted on geographies consisting of 141,415,826 people shows a slight negative correlation between the proportion of Bangladeshis and labor force participation rate among population between the ages 16 and 19 in the United States with a correlation coefficient (R) of -0.067 and weighted average of 42.5%, a difference of 5.0%.
In Labor Force | Age 16-19 Correlation Summary
| Measurement | Lithuanian | Bangladeshi |
| Minimum | 15.0% | 25.3% |
| Maximum | 100.0% | 62.5% |
| Range | 85.0% | 37.2% |
| Mean | 52.1% | 43.1% |
| Median | 44.5% | 43.3% |
| Interquartile 25% (IQ1) | 39.3% | 36.4% |
| Interquartile 75% (IQ3) | 60.6% | 49.6% |
| Interquartile Range (IQR) | 21.2% | 13.2% |
| Standard Deviation (Sample) | 22.6% | 8.6% |
| Standard Deviation (Population) | 22.4% | 8.5% |
Similar Demographics by In Labor Force | Age 16-19
Demographics Similar to Lithuanians by In Labor Force | Age 16-19
In terms of in labor force | age 16-19, the demographic groups most similar to Lithuanians are Aleut (40.4%, a difference of 0.010%), Fijian (40.4%, a difference of 0.030%), British (40.5%, a difference of 0.11%), Tlingit-Haida (40.5%, a difference of 0.14%), and Slavic (40.4%, a difference of 0.15%).
| Demographics | Rating | Rank | In Labor Force | Age 16-19 |
| Indonesians | 100.0 /100 | #50 | Exceptional 40.7% |
| Immigrants | Zaire | 100.0 /100 | #51 | Exceptional 40.7% |
| Immigrants | Laos | 100.0 /100 | #52 | Exceptional 40.6% |
| Immigrants | Kenya | 100.0 /100 | #53 | Exceptional 40.5% |
| Tlingit-Haida | 100.0 /100 | #54 | Exceptional 40.5% |
| British | 100.0 /100 | #55 | Exceptional 40.5% |
| Fijians | 100.0 /100 | #56 | Exceptional 40.4% |
| Lithuanians | 100.0 /100 | #57 | Exceptional 40.4% |
| Aleuts | 100.0 /100 | #58 | Exceptional 40.4% |
| Slavs | 100.0 /100 | #59 | Exceptional 40.4% |
| Immigrants | Eastern Africa | 100.0 /100 | #60 | Exceptional 40.4% |
| Americans | 100.0 /100 | #61 | Exceptional 40.3% |
| Cherokee | 100.0 /100 | #62 | Exceptional 40.2% |
| Northern Europeans | 100.0 /100 | #63 | Exceptional 40.2% |
| Immigrants | Micronesia | 100.0 /100 | #64 | Exceptional 40.2% |
Demographics Similar to Bangladeshis by In Labor Force | Age 16-19
In terms of in labor force | age 16-19, the demographic groups most similar to Bangladeshis are German Russian (42.4%, a difference of 0.080%), English (42.4%, a difference of 0.21%), Slovak (42.6%, a difference of 0.33%), Welsh (42.3%, a difference of 0.48%), and Polish (42.1%, a difference of 0.78%).
| Demographics | Rating | Rank | In Labor Force | Age 16-19 |
| Scandinavians | 100.0 /100 | #17 | Exceptional 43.6% |
| French Canadians | 100.0 /100 | #18 | Exceptional 43.6% |
| Belgians | 100.0 /100 | #19 | Exceptional 43.4% |
| Swiss | 100.0 /100 | #20 | Exceptional 43.3% |
| Ottawa | 100.0 /100 | #21 | Exceptional 43.0% |
| Sudanese | 100.0 /100 | #22 | Exceptional 42.9% |
| Slovaks | 100.0 /100 | #23 | Exceptional 42.6% |
| Bangladeshis | 100.0 /100 | #24 | Exceptional 42.5% |
| German Russians | 100.0 /100 | #25 | Exceptional 42.4% |
| English | 100.0 /100 | #26 | Exceptional 42.4% |
| Welsh | 100.0 /100 | #27 | Exceptional 42.3% |
| Poles | 100.0 /100 | #28 | Exceptional 42.1% |
| French | 100.0 /100 | #29 | Exceptional 42.1% |
| Scottish | 100.0 /100 | #30 | Exceptional 42.0% |
| Irish | 100.0 /100 | #31 | Exceptional 42.0% |