Lithuanian vs Egyptian In Labor Force | Age 16-19
COMPARE
Lithuanian
Egyptian
In Labor Force | Age 16-19
In Labor Force | Age 16-19 Comparison
Lithuanians
Egyptians
40.4%
IN LABOR FORCE | AGE 16-19
100.0/ 100
METRIC RATING
57th/ 347
METRIC RANK
34.5%
IN LABOR FORCE | AGE 16-19
1.2/ 100
METRIC RATING
260th/ 347
METRIC RANK
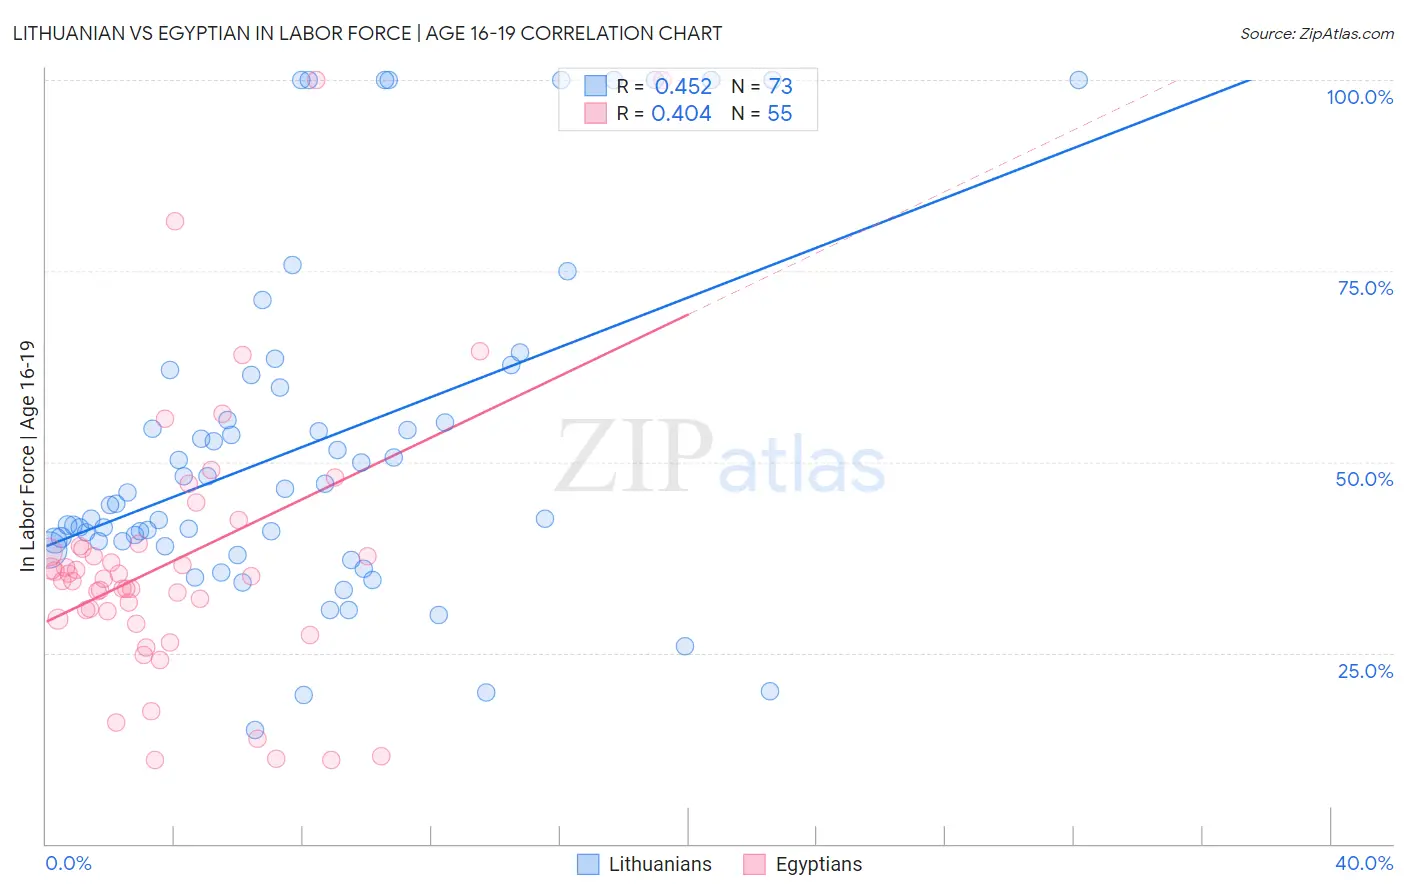
Lithuanian vs Egyptian In Labor Force | Age 16-19 Correlation Chart
The statistical analysis conducted on geographies consisting of 420,922,487 people shows a moderate positive correlation between the proportion of Lithuanians and labor force participation rate among population between the ages 16 and 19 in the United States with a correlation coefficient (R) of 0.452 and weighted average of 40.4%. Similarly, the statistical analysis conducted on geographies consisting of 276,688,548 people shows a moderate positive correlation between the proportion of Egyptians and labor force participation rate among population between the ages 16 and 19 in the United States with a correlation coefficient (R) of 0.404 and weighted average of 34.5%, a difference of 17.1%.
In Labor Force | Age 16-19 Correlation Summary
| Measurement | Lithuanian | Egyptian |
| Minimum | 15.0% | 11.0% |
| Maximum | 100.0% | 100.0% |
| Range | 85.0% | 89.0% |
| Mean | 52.1% | 37.1% |
| Median | 44.5% | 34.7% |
| Interquartile 25% (IQ1) | 39.3% | 29.4% |
| Interquartile 75% (IQ3) | 60.6% | 39.0% |
| Interquartile Range (IQR) | 21.2% | 9.6% |
| Standard Deviation (Sample) | 22.6% | 18.1% |
| Standard Deviation (Population) | 22.4% | 17.9% |
Similar Demographics by In Labor Force | Age 16-19
Demographics Similar to Lithuanians by In Labor Force | Age 16-19
In terms of in labor force | age 16-19, the demographic groups most similar to Lithuanians are Aleut (40.4%, a difference of 0.010%), Fijian (40.4%, a difference of 0.030%), British (40.5%, a difference of 0.11%), Tlingit-Haida (40.5%, a difference of 0.14%), and Slavic (40.4%, a difference of 0.15%).
| Demographics | Rating | Rank | In Labor Force | Age 16-19 |
| Indonesians | 100.0 /100 | #50 | Exceptional 40.7% |
| Immigrants | Zaire | 100.0 /100 | #51 | Exceptional 40.7% |
| Immigrants | Laos | 100.0 /100 | #52 | Exceptional 40.6% |
| Immigrants | Kenya | 100.0 /100 | #53 | Exceptional 40.5% |
| Tlingit-Haida | 100.0 /100 | #54 | Exceptional 40.5% |
| British | 100.0 /100 | #55 | Exceptional 40.5% |
| Fijians | 100.0 /100 | #56 | Exceptional 40.4% |
| Lithuanians | 100.0 /100 | #57 | Exceptional 40.4% |
| Aleuts | 100.0 /100 | #58 | Exceptional 40.4% |
| Slavs | 100.0 /100 | #59 | Exceptional 40.4% |
| Immigrants | Eastern Africa | 100.0 /100 | #60 | Exceptional 40.4% |
| Americans | 100.0 /100 | #61 | Exceptional 40.3% |
| Cherokee | 100.0 /100 | #62 | Exceptional 40.2% |
| Northern Europeans | 100.0 /100 | #63 | Exceptional 40.2% |
| Immigrants | Micronesia | 100.0 /100 | #64 | Exceptional 40.2% |
Demographics Similar to Egyptians by In Labor Force | Age 16-19
In terms of in labor force | age 16-19, the demographic groups most similar to Egyptians are Salvadoran (34.5%, a difference of 0.040%), Hispanic or Latino (34.5%, a difference of 0.050%), Immigrants (34.6%, a difference of 0.080%), Burmese (34.5%, a difference of 0.090%), and Immigrants from Egypt (34.6%, a difference of 0.10%).
| Demographics | Rating | Rank | In Labor Force | Age 16-19 |
| Immigrants | Japan | 1.5 /100 | #253 | Tragic 34.7% |
| Bahamians | 1.4 /100 | #254 | Tragic 34.6% |
| Peruvians | 1.4 /100 | #255 | Tragic 34.6% |
| Immigrants | South Central Asia | 1.3 /100 | #256 | Tragic 34.6% |
| Immigrants | Egypt | 1.2 /100 | #257 | Tragic 34.6% |
| Thais | 1.2 /100 | #258 | Tragic 34.6% |
| Immigrants | Immigrants | 1.2 /100 | #259 | Tragic 34.6% |
| Egyptians | 1.2 /100 | #260 | Tragic 34.5% |
| Salvadorans | 1.1 /100 | #261 | Tragic 34.5% |
| Hispanics or Latinos | 1.1 /100 | #262 | Tragic 34.5% |
| Burmese | 1.1 /100 | #263 | Tragic 34.5% |
| Immigrants | Uruguay | 0.9 /100 | #264 | Tragic 34.4% |
| Immigrants | El Salvador | 0.7 /100 | #265 | Tragic 34.3% |
| Immigrants | Malaysia | 0.7 /100 | #266 | Tragic 34.3% |
| Immigrants | Peru | 0.5 /100 | #267 | Tragic 34.2% |