Lithuanian vs Hungarian In Labor Force | Age 16-19
COMPARE
Lithuanian
Hungarian
In Labor Force | Age 16-19
In Labor Force | Age 16-19 Comparison
Lithuanians
Hungarians
40.4%
IN LABOR FORCE | AGE 16-19
100.0/ 100
METRIC RATING
57th/ 347
METRIC RANK
39.8%
IN LABOR FORCE | AGE 16-19
99.9/ 100
METRIC RATING
74th/ 347
METRIC RANK
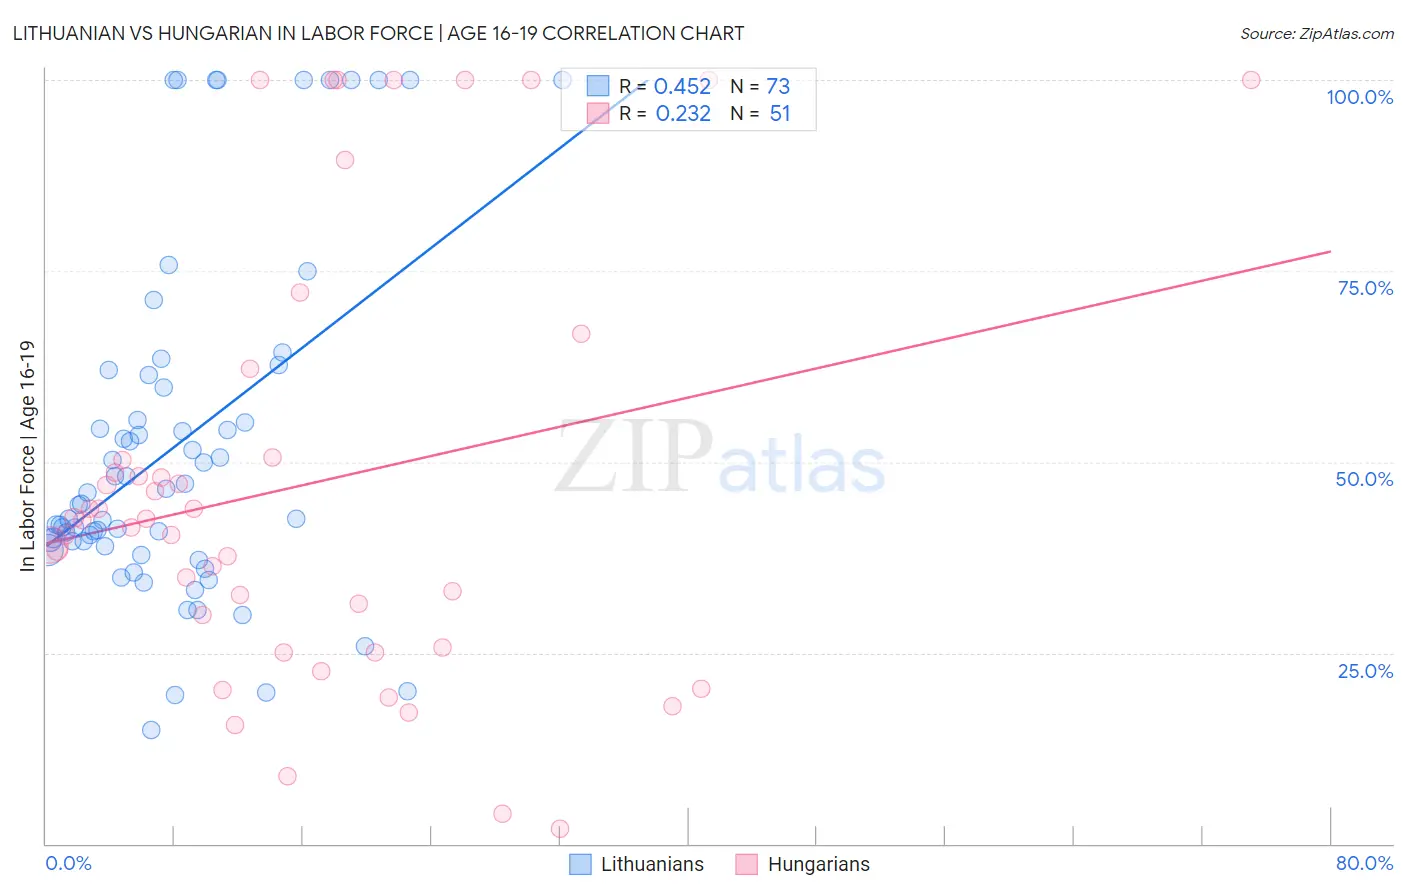
Lithuanian vs Hungarian In Labor Force | Age 16-19 Correlation Chart
The statistical analysis conducted on geographies consisting of 420,922,487 people shows a moderate positive correlation between the proportion of Lithuanians and labor force participation rate among population between the ages 16 and 19 in the United States with a correlation coefficient (R) of 0.452 and weighted average of 40.4%. Similarly, the statistical analysis conducted on geographies consisting of 484,680,746 people shows a weak positive correlation between the proportion of Hungarians and labor force participation rate among population between the ages 16 and 19 in the United States with a correlation coefficient (R) of 0.232 and weighted average of 39.8%, a difference of 1.5%.
In Labor Force | Age 16-19 Correlation Summary
| Measurement | Lithuanian | Hungarian |
| Minimum | 15.0% | 2.0% |
| Maximum | 100.0% | 100.0% |
| Range | 85.0% | 98.0% |
| Mean | 52.1% | 47.0% |
| Median | 44.5% | 42.4% |
| Interquartile 25% (IQ1) | 39.3% | 25.7% |
| Interquartile 75% (IQ3) | 60.6% | 50.5% |
| Interquartile Range (IQR) | 21.2% | 24.8% |
| Standard Deviation (Sample) | 22.6% | 28.1% |
| Standard Deviation (Population) | 22.4% | 27.8% |
Demographics Similar to Lithuanians and Hungarians by In Labor Force | Age 16-19
In terms of in labor force | age 16-19, the demographic groups most similar to Lithuanians are Aleut (40.4%, a difference of 0.010%), Fijian (40.4%, a difference of 0.030%), British (40.5%, a difference of 0.11%), Slavic (40.4%, a difference of 0.15%), and Immigrants from Eastern Africa (40.4%, a difference of 0.19%). Similarly, the demographic groups most similar to Hungarians are French American Indian (39.8%, a difference of 0.020%), Immigrants from Middle Africa (39.9%, a difference of 0.23%), Iroquois (39.9%, a difference of 0.26%), Serbian (39.9%, a difference of 0.27%), and Portuguese (40.0%, a difference of 0.44%).
| Demographics | Rating | Rank | In Labor Force | Age 16-19 |
| British | 100.0 /100 | #55 | Exceptional 40.5% |
| Fijians | 100.0 /100 | #56 | Exceptional 40.4% |
| Lithuanians | 100.0 /100 | #57 | Exceptional 40.4% |
| Aleuts | 100.0 /100 | #58 | Exceptional 40.4% |
| Slavs | 100.0 /100 | #59 | Exceptional 40.4% |
| Immigrants | Eastern Africa | 100.0 /100 | #60 | Exceptional 40.4% |
| Americans | 100.0 /100 | #61 | Exceptional 40.3% |
| Cherokee | 100.0 /100 | #62 | Exceptional 40.2% |
| Northern Europeans | 100.0 /100 | #63 | Exceptional 40.2% |
| Immigrants | Micronesia | 100.0 /100 | #64 | Exceptional 40.2% |
| Kenyans | 100.0 /100 | #65 | Exceptional 40.1% |
| Immigrants | Nonimmigrants | 100.0 /100 | #66 | Exceptional 40.1% |
| Canadians | 100.0 /100 | #67 | Exceptional 40.1% |
| Italians | 99.9 /100 | #68 | Exceptional 40.1% |
| Potawatomi | 99.9 /100 | #69 | Exceptional 40.0% |
| Portuguese | 99.9 /100 | #70 | Exceptional 40.0% |
| Serbians | 99.9 /100 | #71 | Exceptional 39.9% |
| Iroquois | 99.9 /100 | #72 | Exceptional 39.9% |
| Immigrants | Middle Africa | 99.9 /100 | #73 | Exceptional 39.9% |
| Hungarians | 99.9 /100 | #74 | Exceptional 39.8% |
| French American Indians | 99.9 /100 | #75 | Exceptional 39.8% |