Sioux vs Immigrants from Barbados In Labor Force | Age 16-19
COMPARE
Sioux
Immigrants from Barbados
In Labor Force | Age 16-19
In Labor Force | Age 16-19 Comparison
Sioux
Immigrants from Barbados
41.5%
IN LABOR FORCE | AGE 16-19
100.0/ 100
METRIC RATING
38th/ 347
METRIC RANK
29.0%
IN LABOR FORCE | AGE 16-19
0.0/ 100
METRIC RATING
342nd/ 347
METRIC RANK
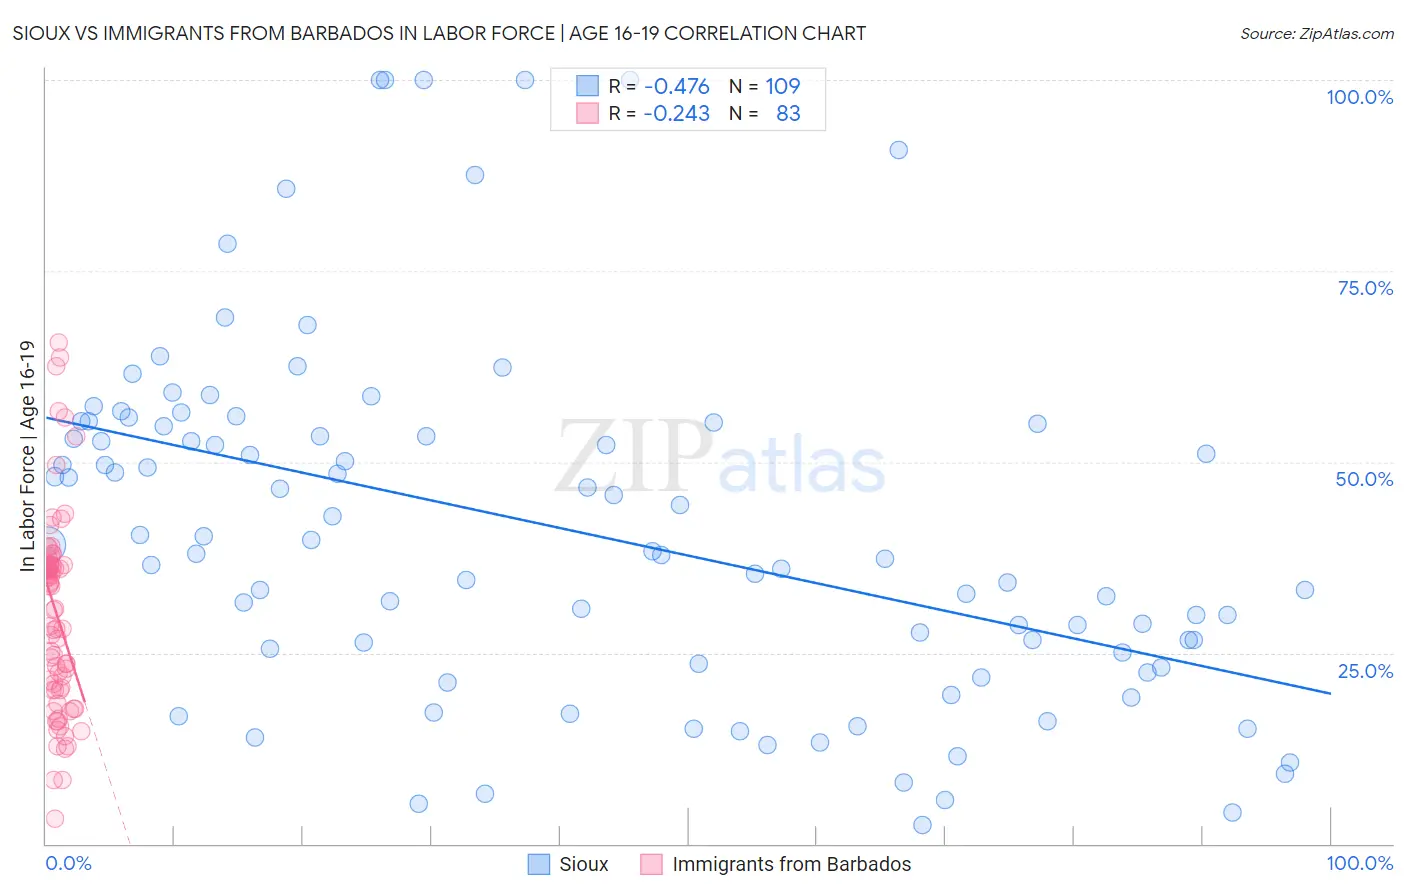
Sioux vs Immigrants from Barbados In Labor Force | Age 16-19 Correlation Chart
The statistical analysis conducted on geographies consisting of 233,888,038 people shows a moderate negative correlation between the proportion of Sioux and labor force participation rate among population between the ages 16 and 19 in the United States with a correlation coefficient (R) of -0.476 and weighted average of 41.5%. Similarly, the statistical analysis conducted on geographies consisting of 112,727,809 people shows a weak negative correlation between the proportion of Immigrants from Barbados and labor force participation rate among population between the ages 16 and 19 in the United States with a correlation coefficient (R) of -0.243 and weighted average of 29.0%, a difference of 43.3%.
In Labor Force | Age 16-19 Correlation Summary
| Measurement | Sioux | Immigrants from Barbados |
| Minimum | 2.4% | 3.3% |
| Maximum | 100.0% | 65.6% |
| Range | 97.6% | 62.3% |
| Mean | 41.1% | 30.3% |
| Median | 38.3% | 33.7% |
| Interquartile 25% (IQ1) | 24.2% | 20.2% |
| Interquartile 75% (IQ3) | 54.9% | 36.5% |
| Interquartile Range (IQR) | 30.6% | 16.3% |
| Standard Deviation (Sample) | 23.0% | 12.8% |
| Standard Deviation (Population) | 22.9% | 12.7% |
Similar Demographics by In Labor Force | Age 16-19
Demographics Similar to Sioux by In Labor Force | Age 16-19
In terms of in labor force | age 16-19, the demographic groups most similar to Sioux are Scotch-Irish (41.5%, a difference of 0.14%), Immigrants from Liberia (41.5%, a difference of 0.23%), Immigrants from Congo (41.7%, a difference of 0.35%), Immigrants from the Azores (41.7%, a difference of 0.42%), and Yugoslavian (41.8%, a difference of 0.57%).
| Demographics | Rating | Rank | In Labor Force | Age 16-19 |
| Irish | 100.0 /100 | #31 | Exceptional 42.0% |
| Czechoslovakians | 100.0 /100 | #32 | Exceptional 41.9% |
| Liberians | 100.0 /100 | #33 | Exceptional 41.8% |
| Immigrants | Bosnia and Herzegovina | 100.0 /100 | #34 | Exceptional 41.8% |
| Yugoslavians | 100.0 /100 | #35 | Exceptional 41.8% |
| Immigrants | Azores | 100.0 /100 | #36 | Exceptional 41.7% |
| Immigrants | Congo | 100.0 /100 | #37 | Exceptional 41.7% |
| Sioux | 100.0 /100 | #38 | Exceptional 41.5% |
| Scotch-Irish | 100.0 /100 | #39 | Exceptional 41.5% |
| Immigrants | Liberia | 100.0 /100 | #40 | Exceptional 41.5% |
| Celtics | 100.0 /100 | #41 | Exceptional 41.3% |
| Whites/Caucasians | 100.0 /100 | #42 | Exceptional 41.3% |
| Tongans | 100.0 /100 | #43 | Exceptional 41.2% |
| Europeans | 100.0 /100 | #44 | Exceptional 41.1% |
| Croatians | 100.0 /100 | #45 | Exceptional 41.1% |
Demographics Similar to Immigrants from Barbados by In Labor Force | Age 16-19
In terms of in labor force | age 16-19, the demographic groups most similar to Immigrants from Barbados are Immigrants from Armenia (29.0%, a difference of 0.15%), British West Indian (29.1%, a difference of 0.38%), Immigrants from Uzbekistan (29.2%, a difference of 0.58%), Vietnamese (29.6%, a difference of 2.0%), and Immigrants from Bangladesh (30.0%, a difference of 3.7%).
| Demographics | Rating | Rank | In Labor Force | Age 16-19 |
| Immigrants | Hong Kong | 0.0 /100 | #333 | Tragic 30.5% |
| Puerto Ricans | 0.0 /100 | #334 | Tragic 30.3% |
| Immigrants | Cuba | 0.0 /100 | #335 | Tragic 30.2% |
| Immigrants | Trinidad and Tobago | 0.0 /100 | #336 | Tragic 30.2% |
| Immigrants | Bangladesh | 0.0 /100 | #337 | Tragic 30.0% |
| Vietnamese | 0.0 /100 | #338 | Tragic 29.6% |
| Immigrants | Uzbekistan | 0.0 /100 | #339 | Tragic 29.2% |
| British West Indians | 0.0 /100 | #340 | Tragic 29.1% |
| Immigrants | Armenia | 0.0 /100 | #341 | Tragic 29.0% |
| Immigrants | Barbados | 0.0 /100 | #342 | Tragic 29.0% |
| Yuman | 0.0 /100 | #343 | Tragic 27.7% |
| Guyanese | 0.0 /100 | #344 | Tragic 27.4% |
| Immigrants | Guyana | 0.0 /100 | #345 | Tragic 27.3% |
| Immigrants | St. Vincent and the Grenadines | 0.0 /100 | #346 | Tragic 26.3% |
| Immigrants | Grenada | 0.0 /100 | #347 | Tragic 25.4% |