Central American vs Immigrants from Barbados In Labor Force | Age 16-19
COMPARE
Central American
Immigrants from Barbados
In Labor Force | Age 16-19
In Labor Force | Age 16-19 Comparison
Central Americans
Immigrants from Barbados
34.8%
IN LABOR FORCE | AGE 16-19
2.2/ 100
METRIC RATING
248th/ 347
METRIC RANK
29.0%
IN LABOR FORCE | AGE 16-19
0.0/ 100
METRIC RATING
342nd/ 347
METRIC RANK
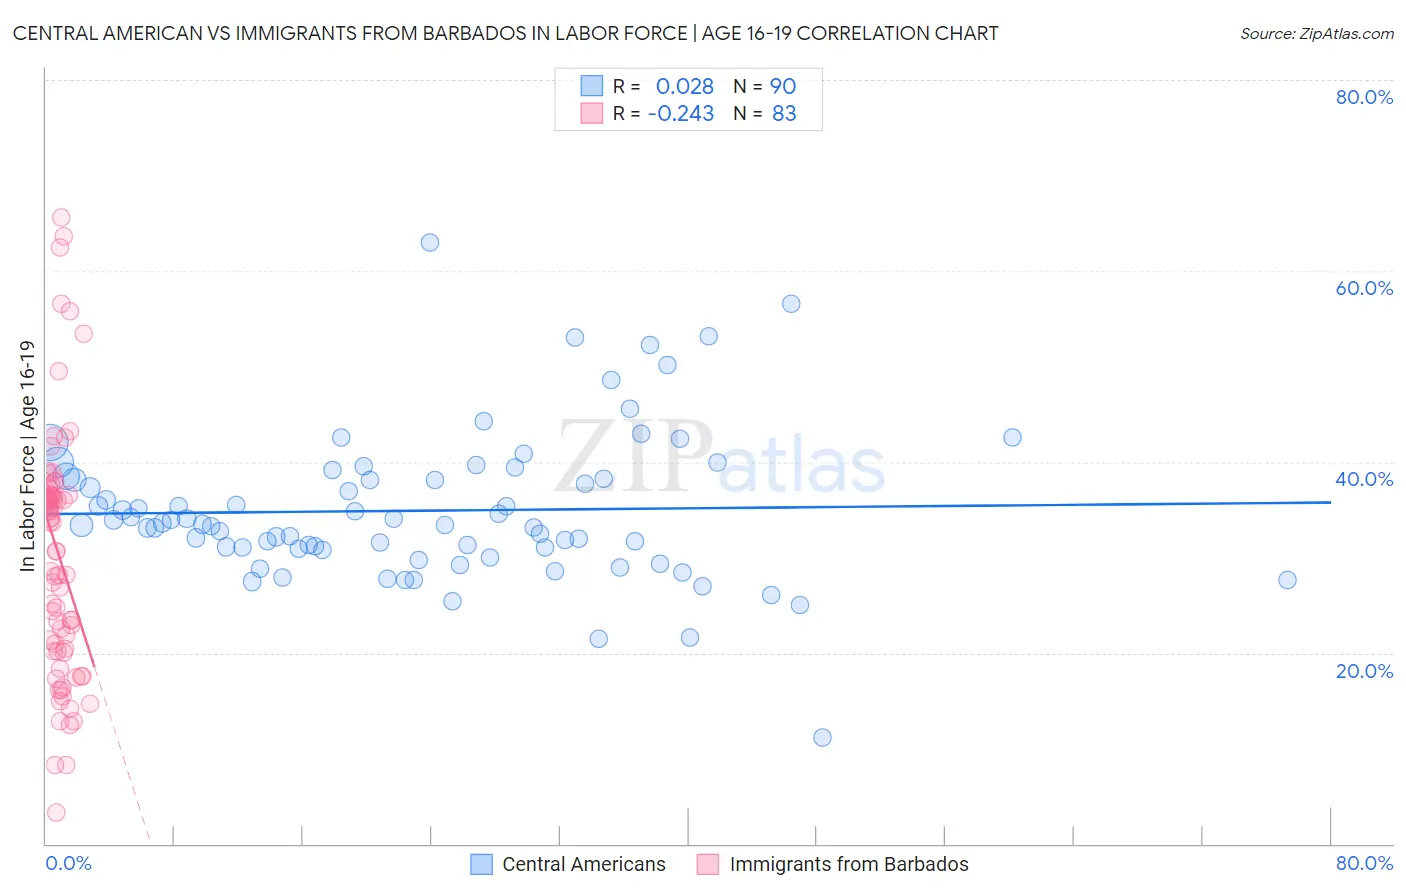
Central American vs Immigrants from Barbados In Labor Force | Age 16-19 Correlation Chart
The statistical analysis conducted on geographies consisting of 503,353,635 people shows no correlation between the proportion of Central Americans and labor force participation rate among population between the ages 16 and 19 in the United States with a correlation coefficient (R) of 0.028 and weighted average of 34.8%. Similarly, the statistical analysis conducted on geographies consisting of 112,727,809 people shows a weak negative correlation between the proportion of Immigrants from Barbados and labor force participation rate among population between the ages 16 and 19 in the United States with a correlation coefficient (R) of -0.243 and weighted average of 29.0%, a difference of 20.2%.
In Labor Force | Age 16-19 Correlation Summary
| Measurement | Central American | Immigrants from Barbados |
| Minimum | 11.1% | 3.3% |
| Maximum | 63.0% | 65.6% |
| Range | 51.9% | 62.3% |
| Mean | 34.9% | 30.3% |
| Median | 33.4% | 33.7% |
| Interquartile 25% (IQ1) | 31.0% | 20.2% |
| Interquartile 75% (IQ3) | 38.2% | 36.5% |
| Interquartile Range (IQR) | 7.2% | 16.3% |
| Standard Deviation (Sample) | 7.8% | 12.8% |
| Standard Deviation (Population) | 7.8% | 12.7% |
Similar Demographics by In Labor Force | Age 16-19
Demographics Similar to Central Americans by In Labor Force | Age 16-19
In terms of in labor force | age 16-19, the demographic groups most similar to Central Americans are Immigrants from Ukraine (34.8%, a difference of 0.030%), Immigrants from Sri Lanka (34.9%, a difference of 0.090%), Laotian (34.9%, a difference of 0.090%), Immigrants from Greece (34.9%, a difference of 0.12%), and Immigrants from Pakistan (34.8%, a difference of 0.13%).
| Demographics | Rating | Rank | In Labor Force | Age 16-19 |
| Immigrants | Ireland | 2.9 /100 | #241 | Tragic 35.0% |
| Uruguayans | 2.6 /100 | #242 | Tragic 34.9% |
| Pueblo | 2.6 /100 | #243 | Tragic 34.9% |
| Immigrants | Turkey | 2.6 /100 | #244 | Tragic 34.9% |
| Immigrants | Greece | 2.4 /100 | #245 | Tragic 34.9% |
| Immigrants | Sri Lanka | 2.4 /100 | #246 | Tragic 34.9% |
| Laotians | 2.4 /100 | #247 | Tragic 34.9% |
| Central Americans | 2.2 /100 | #248 | Tragic 34.8% |
| Immigrants | Ukraine | 2.2 /100 | #249 | Tragic 34.8% |
| Immigrants | Pakistan | 2.0 /100 | #250 | Tragic 34.8% |
| Immigrants | Western Asia | 2.0 /100 | #251 | Tragic 34.8% |
| Immigrants | Chile | 2.0 /100 | #252 | Tragic 34.8% |
| Immigrants | Japan | 1.5 /100 | #253 | Tragic 34.7% |
| Bahamians | 1.4 /100 | #254 | Tragic 34.6% |
| Peruvians | 1.4 /100 | #255 | Tragic 34.6% |
Demographics Similar to Immigrants from Barbados by In Labor Force | Age 16-19
In terms of in labor force | age 16-19, the demographic groups most similar to Immigrants from Barbados are Immigrants from Armenia (29.0%, a difference of 0.15%), British West Indian (29.1%, a difference of 0.38%), Immigrants from Uzbekistan (29.2%, a difference of 0.58%), Vietnamese (29.6%, a difference of 2.0%), and Immigrants from Bangladesh (30.0%, a difference of 3.7%).
| Demographics | Rating | Rank | In Labor Force | Age 16-19 |
| Immigrants | Hong Kong | 0.0 /100 | #333 | Tragic 30.5% |
| Puerto Ricans | 0.0 /100 | #334 | Tragic 30.3% |
| Immigrants | Cuba | 0.0 /100 | #335 | Tragic 30.2% |
| Immigrants | Trinidad and Tobago | 0.0 /100 | #336 | Tragic 30.2% |
| Immigrants | Bangladesh | 0.0 /100 | #337 | Tragic 30.0% |
| Vietnamese | 0.0 /100 | #338 | Tragic 29.6% |
| Immigrants | Uzbekistan | 0.0 /100 | #339 | Tragic 29.2% |
| British West Indians | 0.0 /100 | #340 | Tragic 29.1% |
| Immigrants | Armenia | 0.0 /100 | #341 | Tragic 29.0% |
| Immigrants | Barbados | 0.0 /100 | #342 | Tragic 29.0% |
| Yuman | 0.0 /100 | #343 | Tragic 27.7% |
| Guyanese | 0.0 /100 | #344 | Tragic 27.4% |
| Immigrants | Guyana | 0.0 /100 | #345 | Tragic 27.3% |
| Immigrants | St. Vincent and the Grenadines | 0.0 /100 | #346 | Tragic 26.3% |
| Immigrants | Grenada | 0.0 /100 | #347 | Tragic 25.4% |