Lithuanian vs Immigrants from Barbados Professional Degree
COMPARE
Lithuanian
Immigrants from Barbados
Professional Degree
Professional Degree Comparison
Lithuanians
Immigrants from Barbados
5.4%
PROFESSIONAL DEGREE
99.8/ 100
METRIC RATING
72nd/ 347
METRIC RANK
3.9%
PROFESSIONAL DEGREE
4.0/ 100
METRIC RATING
235th/ 347
METRIC RANK
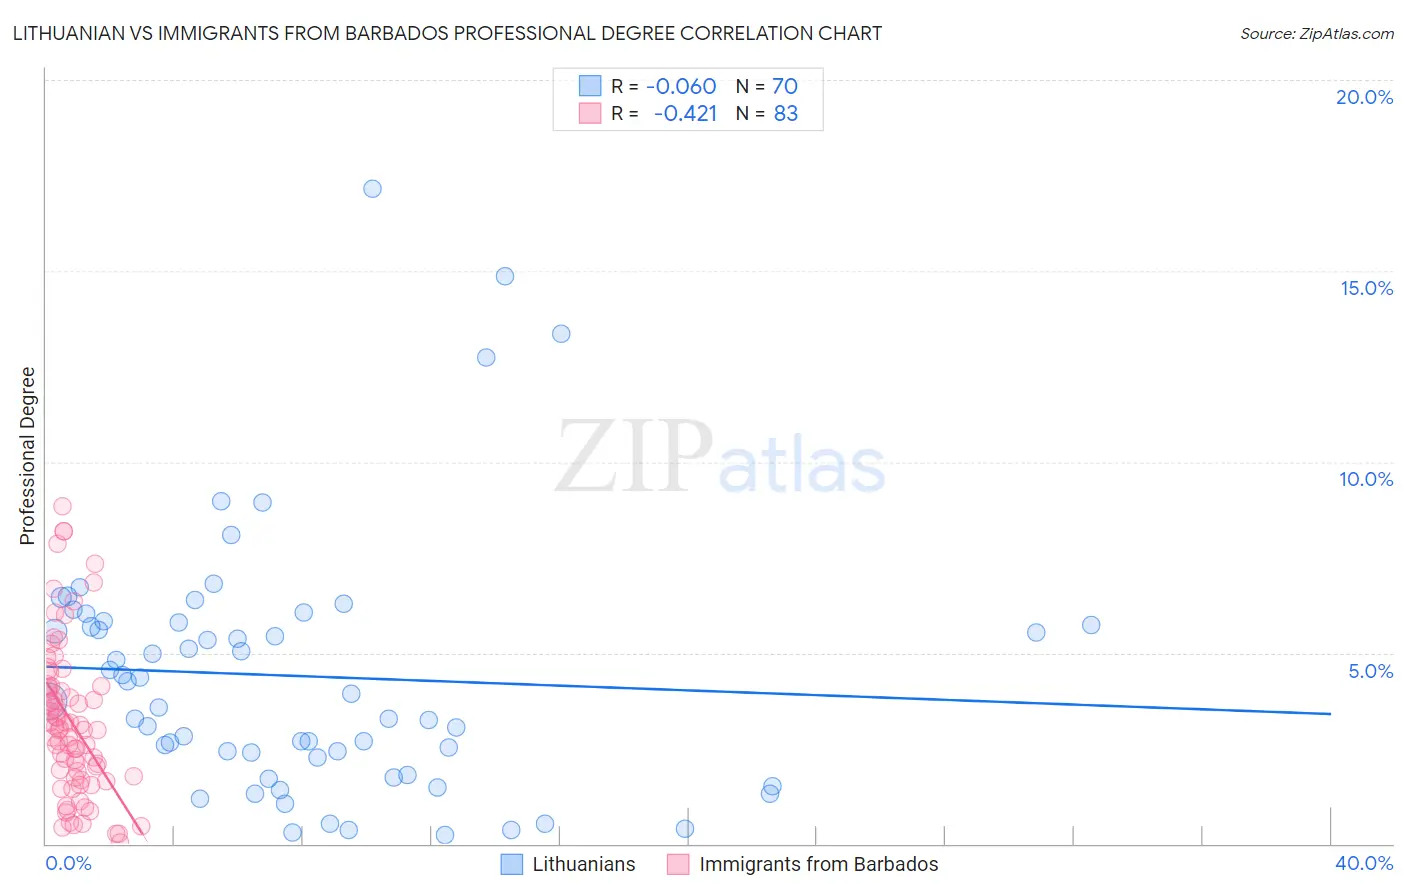
Lithuanian vs Immigrants from Barbados Professional Degree Correlation Chart
The statistical analysis conducted on geographies consisting of 420,702,228 people shows a slight negative correlation between the proportion of Lithuanians and percentage of population with at least professional degree education in the United States with a correlation coefficient (R) of -0.060 and weighted average of 5.4%. Similarly, the statistical analysis conducted on geographies consisting of 112,711,705 people shows a moderate negative correlation between the proportion of Immigrants from Barbados and percentage of population with at least professional degree education in the United States with a correlation coefficient (R) of -0.421 and weighted average of 3.9%, a difference of 38.0%.
Professional Degree Correlation Summary
| Measurement | Lithuanian | Immigrants from Barbados |
| Minimum | 0.24% | 0.017% |
| Maximum | 17.2% | 8.9% |
| Range | 16.9% | 8.8% |
| Mean | 4.4% | 3.2% |
| Median | 3.8% | 3.0% |
| Interquartile 25% (IQ1) | 2.3% | 1.7% |
| Interquartile 75% (IQ3) | 5.8% | 4.1% |
| Interquartile Range (IQR) | 3.5% | 2.4% |
| Standard Deviation (Sample) | 3.4% | 2.0% |
| Standard Deviation (Population) | 3.3% | 2.0% |
Similar Demographics by Professional Degree
Demographics Similar to Lithuanians by Professional Degree
In terms of professional degree, the demographic groups most similar to Lithuanians are Immigrants from Romania (5.4%, a difference of 0.10%), Ethiopian (5.4%, a difference of 0.47%), Immigrants from Western Asia (5.4%, a difference of 0.48%), Immigrants from Indonesia (5.3%, a difference of 0.61%), and Immigrants from Canada (5.3%, a difference of 0.69%).
| Demographics | Rating | Rank | Professional Degree |
| Immigrants | Bolivia | 99.9 /100 | #65 | Exceptional 5.5% |
| Immigrants | Kazakhstan | 99.9 /100 | #66 | Exceptional 5.5% |
| Immigrants | Bulgaria | 99.9 /100 | #67 | Exceptional 5.5% |
| Immigrants | Lebanon | 99.9 /100 | #68 | Exceptional 5.5% |
| Immigrants | Hungary | 99.9 /100 | #69 | Exceptional 5.5% |
| Bhutanese | 99.8 /100 | #70 | Exceptional 5.4% |
| Immigrants | Western Asia | 99.8 /100 | #71 | Exceptional 5.4% |
| Lithuanians | 99.8 /100 | #72 | Exceptional 5.4% |
| Immigrants | Romania | 99.8 /100 | #73 | Exceptional 5.4% |
| Ethiopians | 99.7 /100 | #74 | Exceptional 5.4% |
| Immigrants | Indonesia | 99.7 /100 | #75 | Exceptional 5.3% |
| Immigrants | Canada | 99.7 /100 | #76 | Exceptional 5.3% |
| Immigrants | Ethiopia | 99.7 /100 | #77 | Exceptional 5.3% |
| Armenians | 99.7 /100 | #78 | Exceptional 5.3% |
| Immigrants | North America | 99.7 /100 | #79 | Exceptional 5.3% |
Demographics Similar to Immigrants from Barbados by Professional Degree
In terms of professional degree, the demographic groups most similar to Immigrants from Barbados are Nonimmigrants (3.9%, a difference of 0.010%), Immigrants from Philippines (3.9%, a difference of 0.050%), Spanish American (3.9%, a difference of 0.22%), Immigrants from Trinidad and Tobago (3.9%, a difference of 0.29%), and Cree (3.9%, a difference of 0.31%).
| Demographics | Rating | Rank | Professional Degree |
| Immigrants | West Indies | 5.6 /100 | #228 | Tragic 4.0% |
| Immigrants | Burma/Myanmar | 5.4 /100 | #229 | Tragic 3.9% |
| Nicaraguans | 5.1 /100 | #230 | Tragic 3.9% |
| Ecuadorians | 4.6 /100 | #231 | Tragic 3.9% |
| Cree | 4.3 /100 | #232 | Tragic 3.9% |
| Immigrants | Philippines | 4.1 /100 | #233 | Tragic 3.9% |
| Immigrants | Nonimmigrants | 4.0 /100 | #234 | Tragic 3.9% |
| Immigrants | Barbados | 4.0 /100 | #235 | Tragic 3.9% |
| Spanish Americans | 3.8 /100 | #236 | Tragic 3.9% |
| Immigrants | Trinidad and Tobago | 3.8 /100 | #237 | Tragic 3.9% |
| Colville | 2.6 /100 | #238 | Tragic 3.8% |
| British West Indians | 2.4 /100 | #239 | Tragic 3.8% |
| Immigrants | Ecuador | 2.3 /100 | #240 | Tragic 3.8% |
| Alaskan Athabascans | 2.3 /100 | #241 | Tragic 3.8% |
| Native Hawaiians | 2.3 /100 | #242 | Tragic 3.8% |