Latvian vs Delaware In Labor Force | Age 16-19
COMPARE
Latvian
Delaware
In Labor Force | Age 16-19
In Labor Force | Age 16-19 Comparison
Latvians
Delaware
38.9%
IN LABOR FORCE | AGE 16-19
99.4/ 100
METRIC RATING
96th/ 347
METRIC RANK
38.6%
IN LABOR FORCE | AGE 16-19
98.8/ 100
METRIC RATING
106th/ 347
METRIC RANK
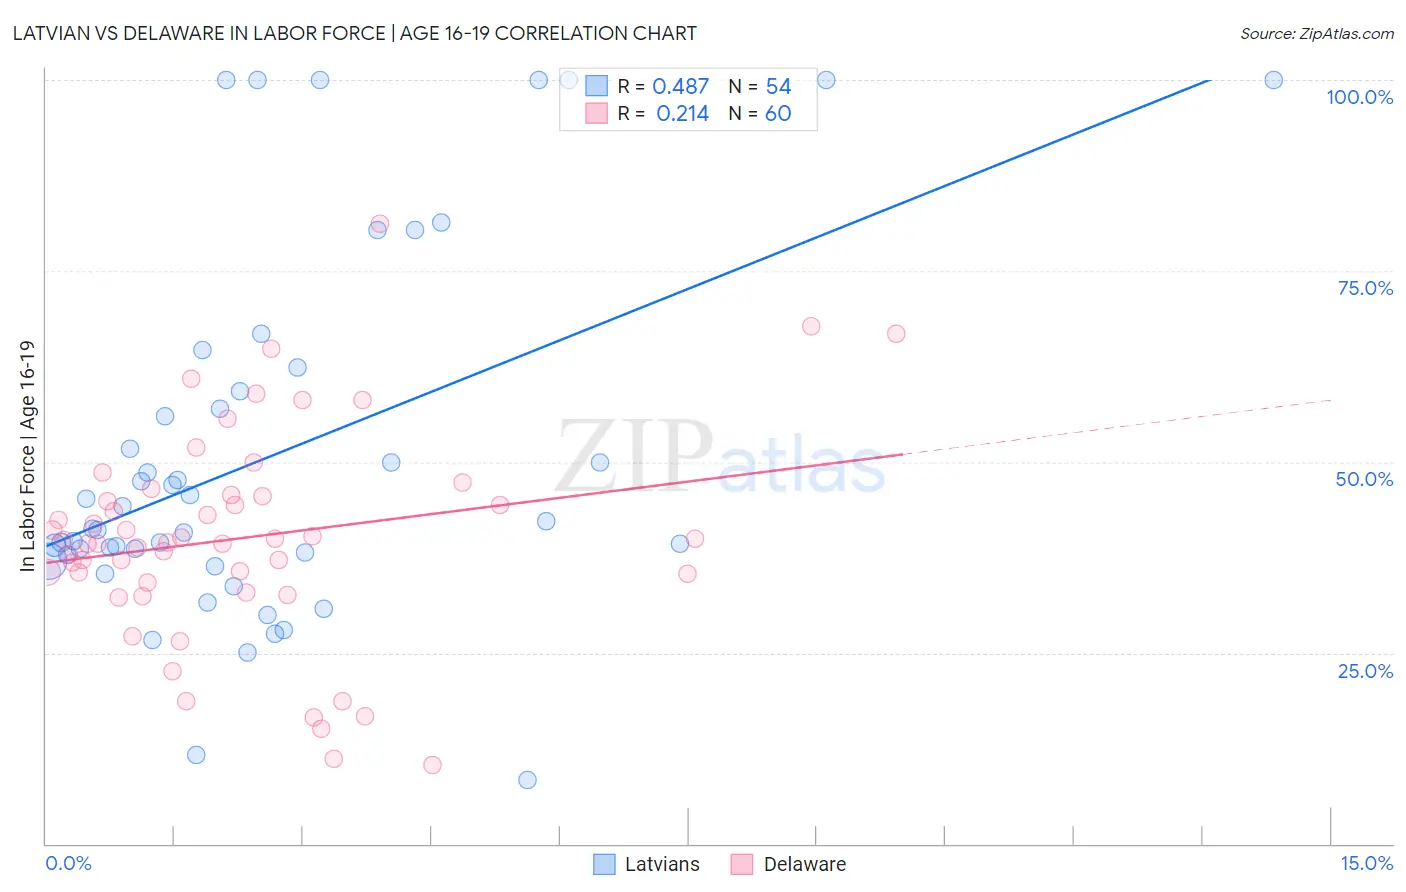
Latvian vs Delaware In Labor Force | Age 16-19 Correlation Chart
The statistical analysis conducted on geographies consisting of 220,454,154 people shows a moderate positive correlation between the proportion of Latvians and labor force participation rate among population between the ages 16 and 19 in the United States with a correlation coefficient (R) of 0.487 and weighted average of 38.9%. Similarly, the statistical analysis conducted on geographies consisting of 96,193,348 people shows a weak positive correlation between the proportion of Delaware and labor force participation rate among population between the ages 16 and 19 in the United States with a correlation coefficient (R) of 0.214 and weighted average of 38.6%, a difference of 0.69%.
In Labor Force | Age 16-19 Correlation Summary
| Measurement | Latvian | Delaware |
| Minimum | 8.4% | 10.3% |
| Maximum | 100.0% | 81.2% |
| Range | 91.6% | 70.9% |
| Mean | 50.8% | 40.1% |
| Median | 41.8% | 39.6% |
| Interquartile 25% (IQ1) | 37.8% | 34.7% |
| Interquartile 75% (IQ3) | 59.2% | 45.6% |
| Interquartile Range (IQR) | 21.4% | 10.9% |
| Standard Deviation (Sample) | 23.9% | 13.9% |
| Standard Deviation (Population) | 23.6% | 13.8% |
Demographics Similar to Latvians and Delaware by In Labor Force | Age 16-19
In terms of in labor force | age 16-19, the demographic groups most similar to Latvians are Immigrants from North America (38.9%, a difference of 0.030%), Greek (38.9%, a difference of 0.040%), Ugandan (38.9%, a difference of 0.050%), Immigrants from North Macedonia (38.9%, a difference of 0.070%), and Immigrants from Canada (38.9%, a difference of 0.12%). Similarly, the demographic groups most similar to Delaware are Iraqi (38.6%, a difference of 0.020%), Chinese (38.6%, a difference of 0.030%), Immigrants from Ethiopia (38.6%, a difference of 0.13%), Lebanese (38.6%, a difference of 0.13%), and Immigrants from Eritrea (38.7%, a difference of 0.17%).
| Demographics | Rating | Rank | In Labor Force | Age 16-19 |
| Spanish Americans | 99.5 /100 | #91 | Exceptional 39.0% |
| Osage | 99.4 /100 | #92 | Exceptional 39.0% |
| Blackfeet | 99.4 /100 | #93 | Exceptional 38.9% |
| Immigrants | Canada | 99.4 /100 | #94 | Exceptional 38.9% |
| Immigrants | North America | 99.4 /100 | #95 | Exceptional 38.9% |
| Latvians | 99.4 /100 | #96 | Exceptional 38.9% |
| Greeks | 99.3 /100 | #97 | Exceptional 38.9% |
| Ugandans | 99.3 /100 | #98 | Exceptional 38.9% |
| Immigrants | North Macedonia | 99.3 /100 | #99 | Exceptional 38.9% |
| Immigrants | Thailand | 99.1 /100 | #100 | Exceptional 38.7% |
| Hmong | 99.1 /100 | #101 | Exceptional 38.7% |
| Zimbabweans | 99.1 /100 | #102 | Exceptional 38.7% |
| Immigrants | Cameroon | 99.0 /100 | #103 | Exceptional 38.7% |
| Immigrants | Eritrea | 99.0 /100 | #104 | Exceptional 38.7% |
| Iraqis | 98.9 /100 | #105 | Exceptional 38.6% |
| Delaware | 98.8 /100 | #106 | Exceptional 38.6% |
| Chinese | 98.8 /100 | #107 | Exceptional 38.6% |
| Immigrants | Ethiopia | 98.7 /100 | #108 | Exceptional 38.6% |
| Lebanese | 98.7 /100 | #109 | Exceptional 38.6% |
| Maltese | 98.6 /100 | #110 | Exceptional 38.5% |
| Crow | 98.5 /100 | #111 | Exceptional 38.5% |