Immigrants from Honduras vs Delaware In Labor Force | Age 16-19
COMPARE
Immigrants from Honduras
Delaware
In Labor Force | Age 16-19
In Labor Force | Age 16-19 Comparison
Immigrants from Honduras
Delaware
35.2%
IN LABOR FORCE | AGE 16-19
4.9/ 100
METRIC RATING
230th/ 347
METRIC RANK
38.6%
IN LABOR FORCE | AGE 16-19
98.8/ 100
METRIC RATING
106th/ 347
METRIC RANK
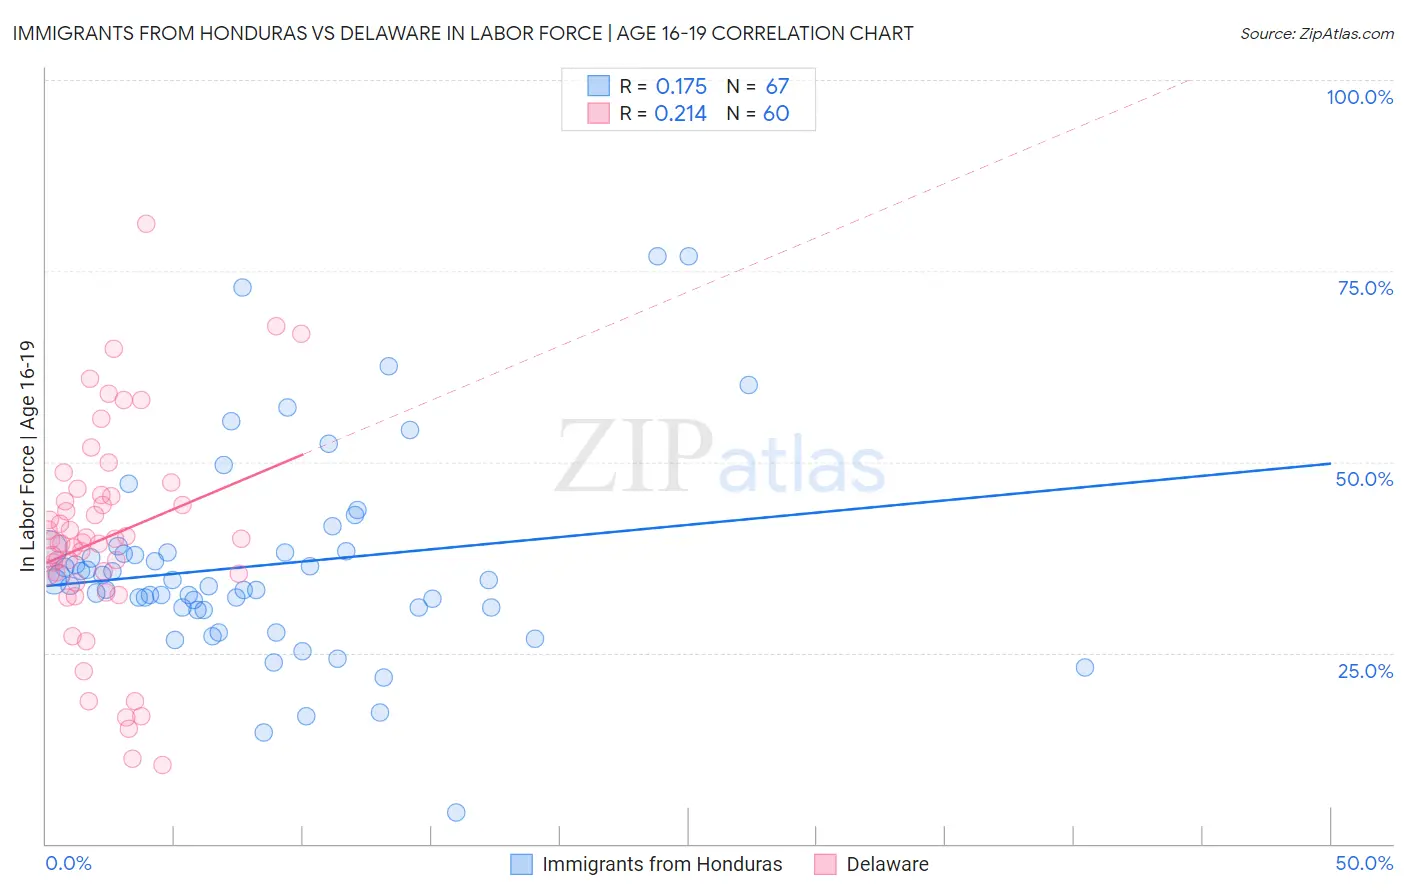
Immigrants from Honduras vs Delaware In Labor Force | Age 16-19 Correlation Chart
The statistical analysis conducted on geographies consisting of 322,269,112 people shows a poor positive correlation between the proportion of Immigrants from Honduras and labor force participation rate among population between the ages 16 and 19 in the United States with a correlation coefficient (R) of 0.175 and weighted average of 35.2%. Similarly, the statistical analysis conducted on geographies consisting of 96,193,348 people shows a weak positive correlation between the proportion of Delaware and labor force participation rate among population between the ages 16 and 19 in the United States with a correlation coefficient (R) of 0.214 and weighted average of 38.6%, a difference of 9.7%.
In Labor Force | Age 16-19 Correlation Summary
| Measurement | Immigrants from Honduras | Delaware |
| Minimum | 4.1% | 10.3% |
| Maximum | 77.0% | 81.2% |
| Range | 72.9% | 70.9% |
| Mean | 36.5% | 40.1% |
| Median | 34.3% | 39.6% |
| Interquartile 25% (IQ1) | 31.0% | 34.7% |
| Interquartile 75% (IQ3) | 38.2% | 45.6% |
| Interquartile Range (IQR) | 7.2% | 10.9% |
| Standard Deviation (Sample) | 13.2% | 13.9% |
| Standard Deviation (Population) | 13.1% | 13.8% |
Similar Demographics by In Labor Force | Age 16-19
Demographics Similar to Immigrants from Honduras by In Labor Force | Age 16-19
In terms of in labor force | age 16-19, the demographic groups most similar to Immigrants from Honduras are Immigrants from Lebanon (35.2%, a difference of 0.030%), Immigrants from Syria (35.2%, a difference of 0.12%), Immigrants from Kazakhstan (35.2%, a difference of 0.12%), Immigrants from Senegal (35.3%, a difference of 0.16%), and Immigrants from France (35.1%, a difference of 0.17%).
| Demographics | Rating | Rank | In Labor Force | Age 16-19 |
| Ghanaians | 6.5 /100 | #223 | Tragic 35.3% |
| Hondurans | 6.5 /100 | #224 | Tragic 35.3% |
| Immigrants | Belgium | 6.1 /100 | #225 | Tragic 35.3% |
| Immigrants | Guatemala | 5.7 /100 | #226 | Tragic 35.3% |
| Mongolians | 5.7 /100 | #227 | Tragic 35.3% |
| Immigrants | Senegal | 5.5 /100 | #228 | Tragic 35.3% |
| Immigrants | Lebanon | 5.0 /100 | #229 | Tragic 35.2% |
| Immigrants | Honduras | 4.9 /100 | #230 | Tragic 35.2% |
| Immigrants | Syria | 4.5 /100 | #231 | Tragic 35.2% |
| Immigrants | Kazakhstan | 4.5 /100 | #232 | Tragic 35.2% |
| Immigrants | France | 4.3 /100 | #233 | Tragic 35.1% |
| Immigrants | Mexico | 4.2 /100 | #234 | Tragic 35.1% |
| Immigrants | Philippines | 4.0 /100 | #235 | Tragic 35.1% |
| Immigrants | Australia | 3.6 /100 | #236 | Tragic 35.1% |
| Immigrants | India | 3.5 /100 | #237 | Tragic 35.0% |
Demographics Similar to Delaware by In Labor Force | Age 16-19
In terms of in labor force | age 16-19, the demographic groups most similar to Delaware are Iraqi (38.6%, a difference of 0.020%), Chinese (38.6%, a difference of 0.030%), Immigrants from Ethiopia (38.6%, a difference of 0.13%), Lebanese (38.6%, a difference of 0.13%), and Immigrants from Eritrea (38.7%, a difference of 0.17%).
| Demographics | Rating | Rank | In Labor Force | Age 16-19 |
| Immigrants | North Macedonia | 99.3 /100 | #99 | Exceptional 38.9% |
| Immigrants | Thailand | 99.1 /100 | #100 | Exceptional 38.7% |
| Hmong | 99.1 /100 | #101 | Exceptional 38.7% |
| Zimbabweans | 99.1 /100 | #102 | Exceptional 38.7% |
| Immigrants | Cameroon | 99.0 /100 | #103 | Exceptional 38.7% |
| Immigrants | Eritrea | 99.0 /100 | #104 | Exceptional 38.7% |
| Iraqis | 98.9 /100 | #105 | Exceptional 38.6% |
| Delaware | 98.8 /100 | #106 | Exceptional 38.6% |
| Chinese | 98.8 /100 | #107 | Exceptional 38.6% |
| Immigrants | Ethiopia | 98.7 /100 | #108 | Exceptional 38.6% |
| Lebanese | 98.7 /100 | #109 | Exceptional 38.6% |
| Maltese | 98.6 /100 | #110 | Exceptional 38.5% |
| Crow | 98.5 /100 | #111 | Exceptional 38.5% |
| Immigrants | Scotland | 98.5 /100 | #112 | Exceptional 38.5% |
| Sub-Saharan Africans | 98.3 /100 | #113 | Exceptional 38.4% |