Immigrants from Germany vs Delaware In Labor Force | Age 16-19
COMPARE
Immigrants from Germany
Delaware
In Labor Force | Age 16-19
In Labor Force | Age 16-19 Comparison
Immigrants from Germany
Delaware
39.1%
IN LABOR FORCE | AGE 16-19
99.6/ 100
METRIC RATING
87th/ 347
METRIC RANK
38.6%
IN LABOR FORCE | AGE 16-19
98.8/ 100
METRIC RATING
106th/ 347
METRIC RANK
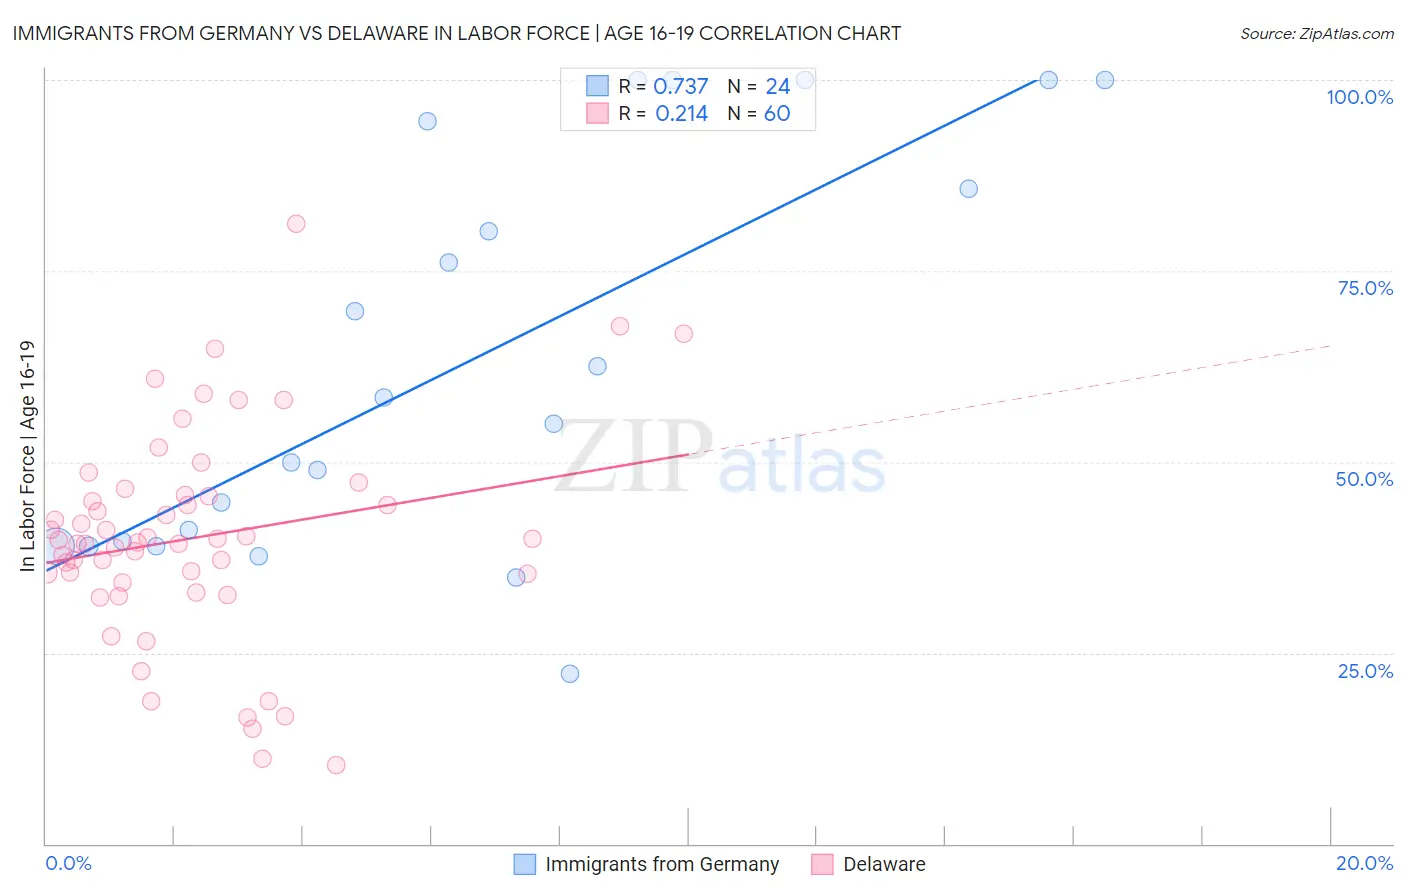
Immigrants from Germany vs Delaware In Labor Force | Age 16-19 Correlation Chart
The statistical analysis conducted on geographies consisting of 462,642,195 people shows a strong positive correlation between the proportion of Immigrants from Germany and labor force participation rate among population between the ages 16 and 19 in the United States with a correlation coefficient (R) of 0.737 and weighted average of 39.1%. Similarly, the statistical analysis conducted on geographies consisting of 96,193,348 people shows a weak positive correlation between the proportion of Delaware and labor force participation rate among population between the ages 16 and 19 in the United States with a correlation coefficient (R) of 0.214 and weighted average of 38.6%, a difference of 1.3%.
In Labor Force | Age 16-19 Correlation Summary
| Measurement | Immigrants from Germany | Delaware |
| Minimum | 22.2% | 10.3% |
| Maximum | 100.0% | 81.2% |
| Range | 77.8% | 70.9% |
| Mean | 63.2% | 40.1% |
| Median | 56.7% | 39.6% |
| Interquartile 25% (IQ1) | 39.3% | 34.7% |
| Interquartile 75% (IQ3) | 90.1% | 45.6% |
| Interquartile Range (IQR) | 50.8% | 10.9% |
| Standard Deviation (Sample) | 26.0% | 13.9% |
| Standard Deviation (Population) | 25.4% | 13.8% |
Demographics Similar to Immigrants from Germany and Delaware by In Labor Force | Age 16-19
In terms of in labor force | age 16-19, the demographic groups most similar to Immigrants from Germany are Puget Sound Salish (39.1%, a difference of 0.070%), Samoan (39.1%, a difference of 0.080%), Alaska Native (39.1%, a difference of 0.080%), Immigrants from Burma/Myanmar (39.0%, a difference of 0.16%), and Spanish American (39.0%, a difference of 0.31%). Similarly, the demographic groups most similar to Delaware are Iraqi (38.6%, a difference of 0.020%), Immigrants from Eritrea (38.7%, a difference of 0.17%), Immigrants from Cameroon (38.7%, a difference of 0.23%), Zimbabwean (38.7%, a difference of 0.26%), and Hmong (38.7%, a difference of 0.27%).
| Demographics | Rating | Rank | In Labor Force | Age 16-19 |
| Samoans | 99.6 /100 | #86 | Exceptional 39.1% |
| Immigrants | Germany | 99.6 /100 | #87 | Exceptional 39.1% |
| Puget Sound Salish | 99.6 /100 | #88 | Exceptional 39.1% |
| Alaska Natives | 99.6 /100 | #89 | Exceptional 39.1% |
| Immigrants | Burma/Myanmar | 99.5 /100 | #90 | Exceptional 39.0% |
| Spanish Americans | 99.5 /100 | #91 | Exceptional 39.0% |
| Osage | 99.4 /100 | #92 | Exceptional 39.0% |
| Blackfeet | 99.4 /100 | #93 | Exceptional 38.9% |
| Immigrants | Canada | 99.4 /100 | #94 | Exceptional 38.9% |
| Immigrants | North America | 99.4 /100 | #95 | Exceptional 38.9% |
| Latvians | 99.4 /100 | #96 | Exceptional 38.9% |
| Greeks | 99.3 /100 | #97 | Exceptional 38.9% |
| Ugandans | 99.3 /100 | #98 | Exceptional 38.9% |
| Immigrants | North Macedonia | 99.3 /100 | #99 | Exceptional 38.9% |
| Immigrants | Thailand | 99.1 /100 | #100 | Exceptional 38.7% |
| Hmong | 99.1 /100 | #101 | Exceptional 38.7% |
| Zimbabweans | 99.1 /100 | #102 | Exceptional 38.7% |
| Immigrants | Cameroon | 99.0 /100 | #103 | Exceptional 38.7% |
| Immigrants | Eritrea | 99.0 /100 | #104 | Exceptional 38.7% |
| Iraqis | 98.9 /100 | #105 | Exceptional 38.6% |
| Delaware | 98.8 /100 | #106 | Exceptional 38.6% |