Latvian vs Immigrants from Sri Lanka In Labor Force | Age 16-19
COMPARE
Latvian
Immigrants from Sri Lanka
In Labor Force | Age 16-19
In Labor Force | Age 16-19 Comparison
Latvians
Immigrants from Sri Lanka
38.9%
IN LABOR FORCE | AGE 16-19
99.4/ 100
METRIC RATING
96th/ 347
METRIC RANK
34.9%
IN LABOR FORCE | AGE 16-19
2.4/ 100
METRIC RATING
246th/ 347
METRIC RANK
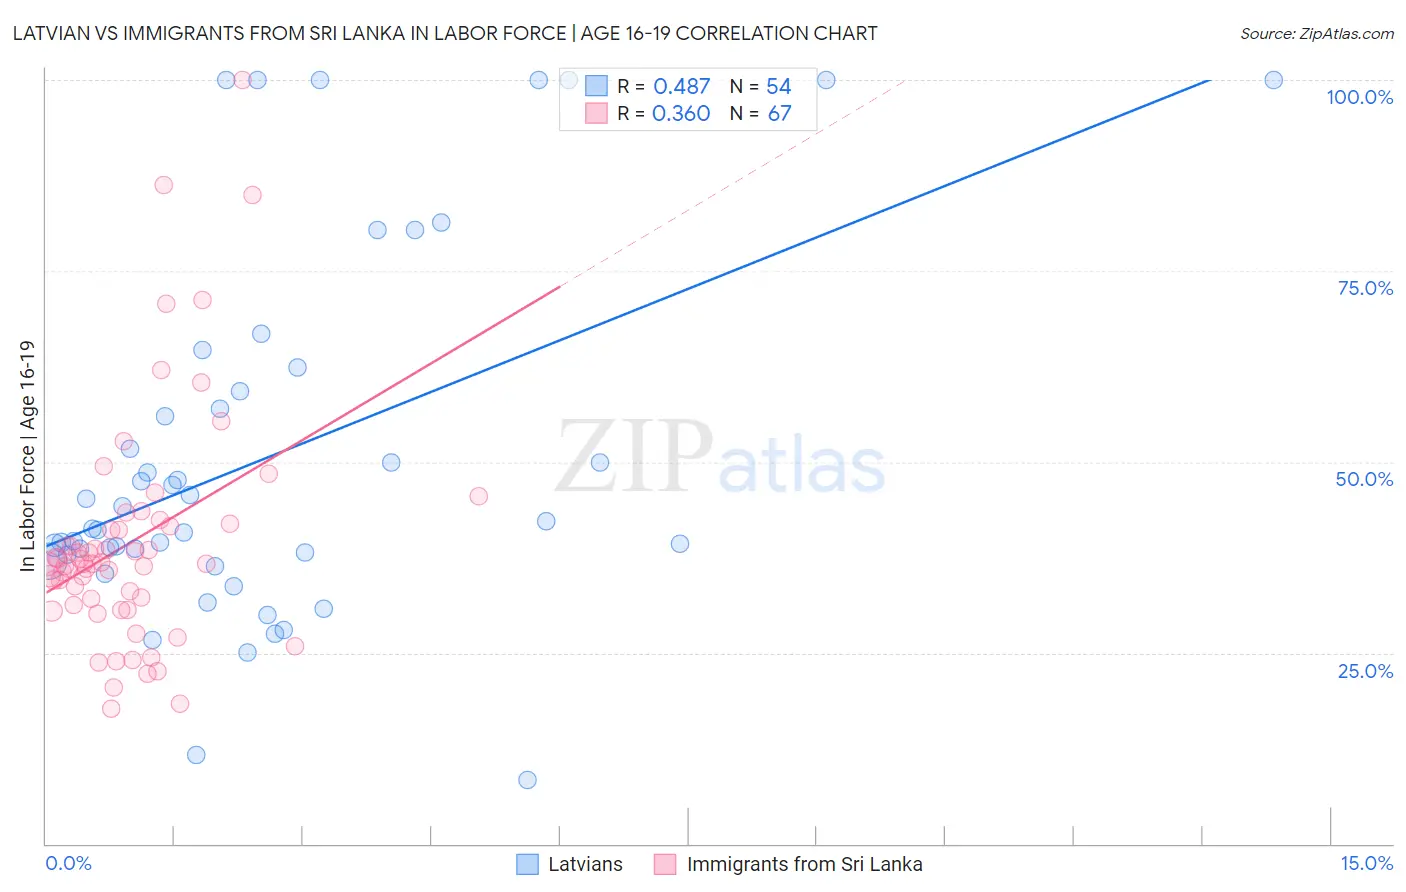
Latvian vs Immigrants from Sri Lanka In Labor Force | Age 16-19 Correlation Chart
The statistical analysis conducted on geographies consisting of 220,454,154 people shows a moderate positive correlation between the proportion of Latvians and labor force participation rate among population between the ages 16 and 19 in the United States with a correlation coefficient (R) of 0.487 and weighted average of 38.9%. Similarly, the statistical analysis conducted on geographies consisting of 149,654,702 people shows a mild positive correlation between the proportion of Immigrants from Sri Lanka and labor force participation rate among population between the ages 16 and 19 in the United States with a correlation coefficient (R) of 0.360 and weighted average of 34.9%, a difference of 11.5%.
In Labor Force | Age 16-19 Correlation Summary
| Measurement | Latvian | Immigrants from Sri Lanka |
| Minimum | 8.4% | 17.6% |
| Maximum | 100.0% | 100.0% |
| Range | 91.6% | 82.4% |
| Mean | 50.8% | 39.5% |
| Median | 41.8% | 36.7% |
| Interquartile 25% (IQ1) | 37.8% | 31.2% |
| Interquartile 75% (IQ3) | 59.2% | 41.9% |
| Interquartile Range (IQR) | 21.4% | 10.7% |
| Standard Deviation (Sample) | 23.9% | 15.4% |
| Standard Deviation (Population) | 23.6% | 15.3% |
Similar Demographics by In Labor Force | Age 16-19
Demographics Similar to Latvians by In Labor Force | Age 16-19
In terms of in labor force | age 16-19, the demographic groups most similar to Latvians are Immigrants from North America (38.9%, a difference of 0.030%), Greek (38.9%, a difference of 0.040%), Ugandan (38.9%, a difference of 0.050%), Immigrants from North Macedonia (38.9%, a difference of 0.070%), and Immigrants from Canada (38.9%, a difference of 0.12%).
| Demographics | Rating | Rank | In Labor Force | Age 16-19 |
| Alaska Natives | 99.6 /100 | #89 | Exceptional 39.1% |
| Immigrants | Burma/Myanmar | 99.5 /100 | #90 | Exceptional 39.0% |
| Spanish Americans | 99.5 /100 | #91 | Exceptional 39.0% |
| Osage | 99.4 /100 | #92 | Exceptional 39.0% |
| Blackfeet | 99.4 /100 | #93 | Exceptional 38.9% |
| Immigrants | Canada | 99.4 /100 | #94 | Exceptional 38.9% |
| Immigrants | North America | 99.4 /100 | #95 | Exceptional 38.9% |
| Latvians | 99.4 /100 | #96 | Exceptional 38.9% |
| Greeks | 99.3 /100 | #97 | Exceptional 38.9% |
| Ugandans | 99.3 /100 | #98 | Exceptional 38.9% |
| Immigrants | North Macedonia | 99.3 /100 | #99 | Exceptional 38.9% |
| Immigrants | Thailand | 99.1 /100 | #100 | Exceptional 38.7% |
| Hmong | 99.1 /100 | #101 | Exceptional 38.7% |
| Zimbabweans | 99.1 /100 | #102 | Exceptional 38.7% |
| Immigrants | Cameroon | 99.0 /100 | #103 | Exceptional 38.7% |
Demographics Similar to Immigrants from Sri Lanka by In Labor Force | Age 16-19
In terms of in labor force | age 16-19, the demographic groups most similar to Immigrants from Sri Lanka are Laotian (34.9%, a difference of 0.010%), Immigrants from Greece (34.9%, a difference of 0.020%), Immigrants from Turkey (34.9%, a difference of 0.080%), Central American (34.8%, a difference of 0.090%), and Pueblo (34.9%, a difference of 0.10%).
| Demographics | Rating | Rank | In Labor Force | Age 16-19 |
| Inupiat | 3.2 /100 | #239 | Tragic 35.0% |
| Immigrants | Central America | 3.0 /100 | #240 | Tragic 35.0% |
| Immigrants | Ireland | 2.9 /100 | #241 | Tragic 35.0% |
| Uruguayans | 2.6 /100 | #242 | Tragic 34.9% |
| Pueblo | 2.6 /100 | #243 | Tragic 34.9% |
| Immigrants | Turkey | 2.6 /100 | #244 | Tragic 34.9% |
| Immigrants | Greece | 2.4 /100 | #245 | Tragic 34.9% |
| Immigrants | Sri Lanka | 2.4 /100 | #246 | Tragic 34.9% |
| Laotians | 2.4 /100 | #247 | Tragic 34.9% |
| Central Americans | 2.2 /100 | #248 | Tragic 34.8% |
| Immigrants | Ukraine | 2.2 /100 | #249 | Tragic 34.8% |
| Immigrants | Pakistan | 2.0 /100 | #250 | Tragic 34.8% |
| Immigrants | Western Asia | 2.0 /100 | #251 | Tragic 34.8% |
| Immigrants | Chile | 2.0 /100 | #252 | Tragic 34.8% |
| Immigrants | Japan | 1.5 /100 | #253 | Tragic 34.7% |