Latvian vs Delaware Vision Disability
COMPARE
Latvian
Delaware
Vision Disability
Vision Disability Comparison
Latvians
Delaware
2.0%
VISION DISABILITY
99.5/ 100
METRIC RATING
49th/ 347
METRIC RANK
2.5%
VISION DISABILITY
0.0/ 100
METRIC RATING
295th/ 347
METRIC RANK
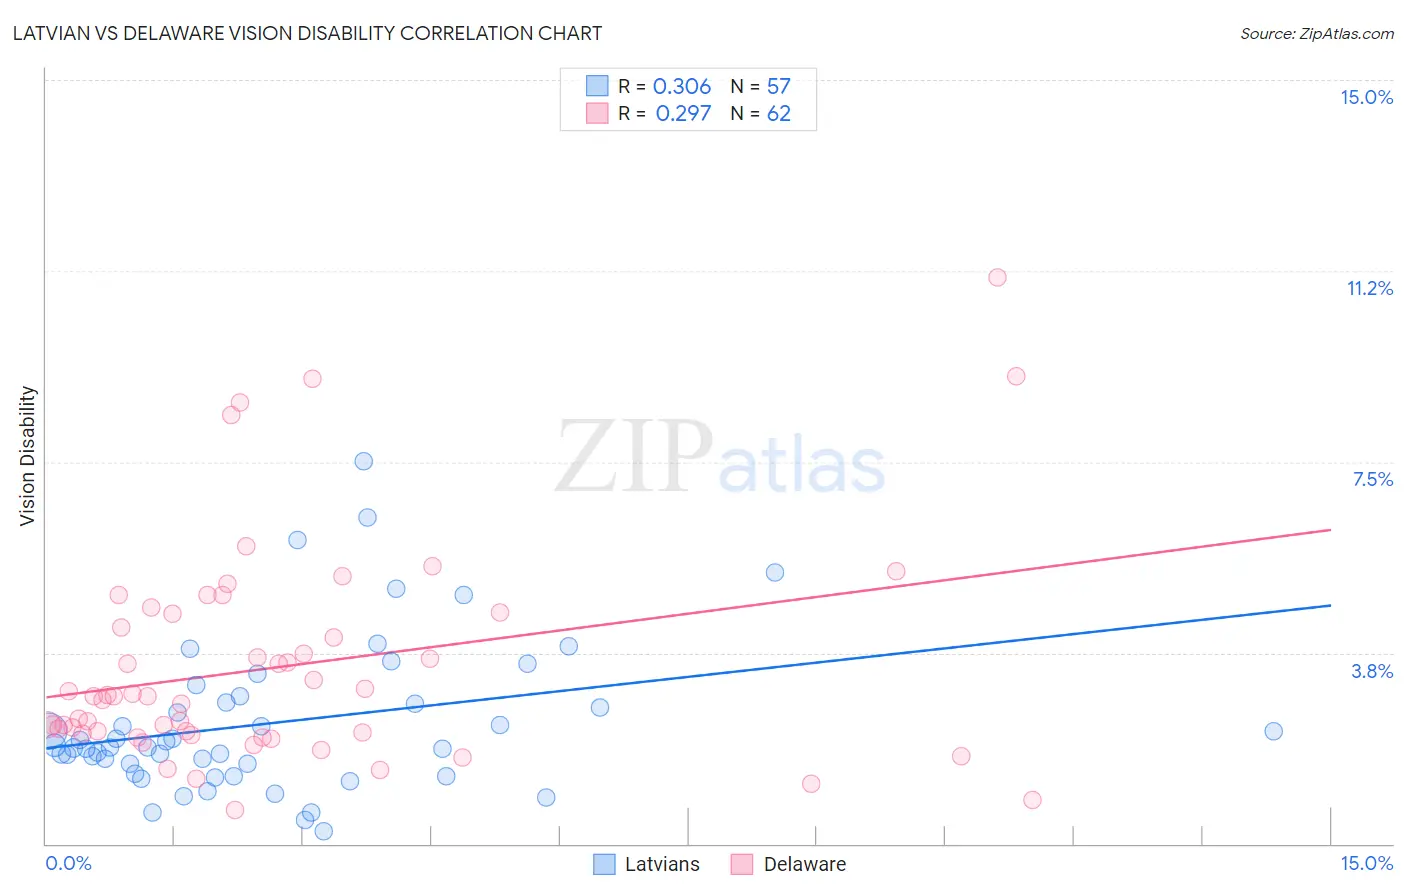
Latvian vs Delaware Vision Disability Correlation Chart
The statistical analysis conducted on geographies consisting of 220,626,631 people shows a mild positive correlation between the proportion of Latvians and percentage of population with vision disability in the United States with a correlation coefficient (R) of 0.306 and weighted average of 2.0%. Similarly, the statistical analysis conducted on geographies consisting of 96,219,222 people shows a weak positive correlation between the proportion of Delaware and percentage of population with vision disability in the United States with a correlation coefficient (R) of 0.297 and weighted average of 2.5%, a difference of 26.5%.
Vision Disability Correlation Summary
| Measurement | Latvian | Delaware |
| Minimum | 0.25% | 0.66% |
| Maximum | 7.5% | 11.1% |
| Range | 7.3% | 10.5% |
| Mean | 2.4% | 3.5% |
| Median | 1.9% | 2.9% |
| Interquartile 25% (IQ1) | 1.5% | 2.2% |
| Interquartile 75% (IQ3) | 2.8% | 4.5% |
| Interquartile Range (IQR) | 1.3% | 2.3% |
| Standard Deviation (Sample) | 1.5% | 2.1% |
| Standard Deviation (Population) | 1.5% | 2.1% |
Similar Demographics by Vision Disability
Demographics Similar to Latvians by Vision Disability
In terms of vision disability, the demographic groups most similar to Latvians are Afghan (2.0%, a difference of 0.060%), Israeli (2.0%, a difference of 0.070%), Tongan (2.0%, a difference of 0.15%), Immigrants from Serbia (2.0%, a difference of 0.46%), and Immigrants from Bulgaria (2.0%, a difference of 0.52%).
| Demographics | Rating | Rank | Vision Disability |
| Immigrants | Ethiopia | 99.7 /100 | #42 | Exceptional 2.0% |
| Eastern Europeans | 99.7 /100 | #43 | Exceptional 2.0% |
| Immigrants | Indonesia | 99.7 /100 | #44 | Exceptional 2.0% |
| Ethiopians | 99.7 /100 | #45 | Exceptional 2.0% |
| Immigrants | Sweden | 99.7 /100 | #46 | Exceptional 2.0% |
| Immigrants | Bulgaria | 99.7 /100 | #47 | Exceptional 2.0% |
| Israelis | 99.6 /100 | #48 | Exceptional 2.0% |
| Latvians | 99.5 /100 | #49 | Exceptional 2.0% |
| Afghans | 99.5 /100 | #50 | Exceptional 2.0% |
| Tongans | 99.5 /100 | #51 | Exceptional 2.0% |
| Immigrants | Serbia | 99.4 /100 | #52 | Exceptional 2.0% |
| Immigrants | Belarus | 99.3 /100 | #53 | Exceptional 2.0% |
| Macedonians | 99.3 /100 | #54 | Exceptional 2.0% |
| Laotians | 99.3 /100 | #55 | Exceptional 2.0% |
| Jordanians | 99.2 /100 | #56 | Exceptional 2.0% |
Demographics Similar to Delaware by Vision Disability
In terms of vision disability, the demographic groups most similar to Delaware are Immigrants from Mexico (2.5%, a difference of 0.11%), Ottawa (2.5%, a difference of 0.21%), Yaqui (2.5%, a difference of 0.55%), Crow (2.5%, a difference of 0.58%), and Immigrants from Honduras (2.5%, a difference of 0.67%).
| Demographics | Rating | Rank | Vision Disability |
| French American Indians | 0.0 /100 | #288 | Tragic 2.5% |
| Immigrants | Nonimmigrants | 0.0 /100 | #289 | Tragic 2.5% |
| Immigrants | Cuba | 0.0 /100 | #290 | Tragic 2.5% |
| Immigrants | Honduras | 0.0 /100 | #291 | Tragic 2.5% |
| Crow | 0.0 /100 | #292 | Tragic 2.5% |
| Yaqui | 0.0 /100 | #293 | Tragic 2.5% |
| Ottawa | 0.0 /100 | #294 | Tragic 2.5% |
| Delaware | 0.0 /100 | #295 | Tragic 2.5% |
| Immigrants | Mexico | 0.0 /100 | #296 | Tragic 2.5% |
| Immigrants | Dominica | 0.0 /100 | #297 | Tragic 2.5% |
| Mexicans | 0.0 /100 | #298 | Tragic 2.5% |
| Cree | 0.0 /100 | #299 | Tragic 2.5% |
| Africans | 0.0 /100 | #300 | Tragic 2.5% |
| Menominee | 0.0 /100 | #301 | Tragic 2.5% |
| Spanish American Indians | 0.0 /100 | #302 | Tragic 2.6% |