Immigrants from South Central Asia vs Delaware In Labor Force | Age 16-19
COMPARE
Immigrants from South Central Asia
Delaware
In Labor Force | Age 16-19
In Labor Force | Age 16-19 Comparison
Immigrants from South Central Asia
Delaware
34.6%
IN LABOR FORCE | AGE 16-19
1.3/ 100
METRIC RATING
256th/ 347
METRIC RANK
38.6%
IN LABOR FORCE | AGE 16-19
98.8/ 100
METRIC RATING
106th/ 347
METRIC RANK
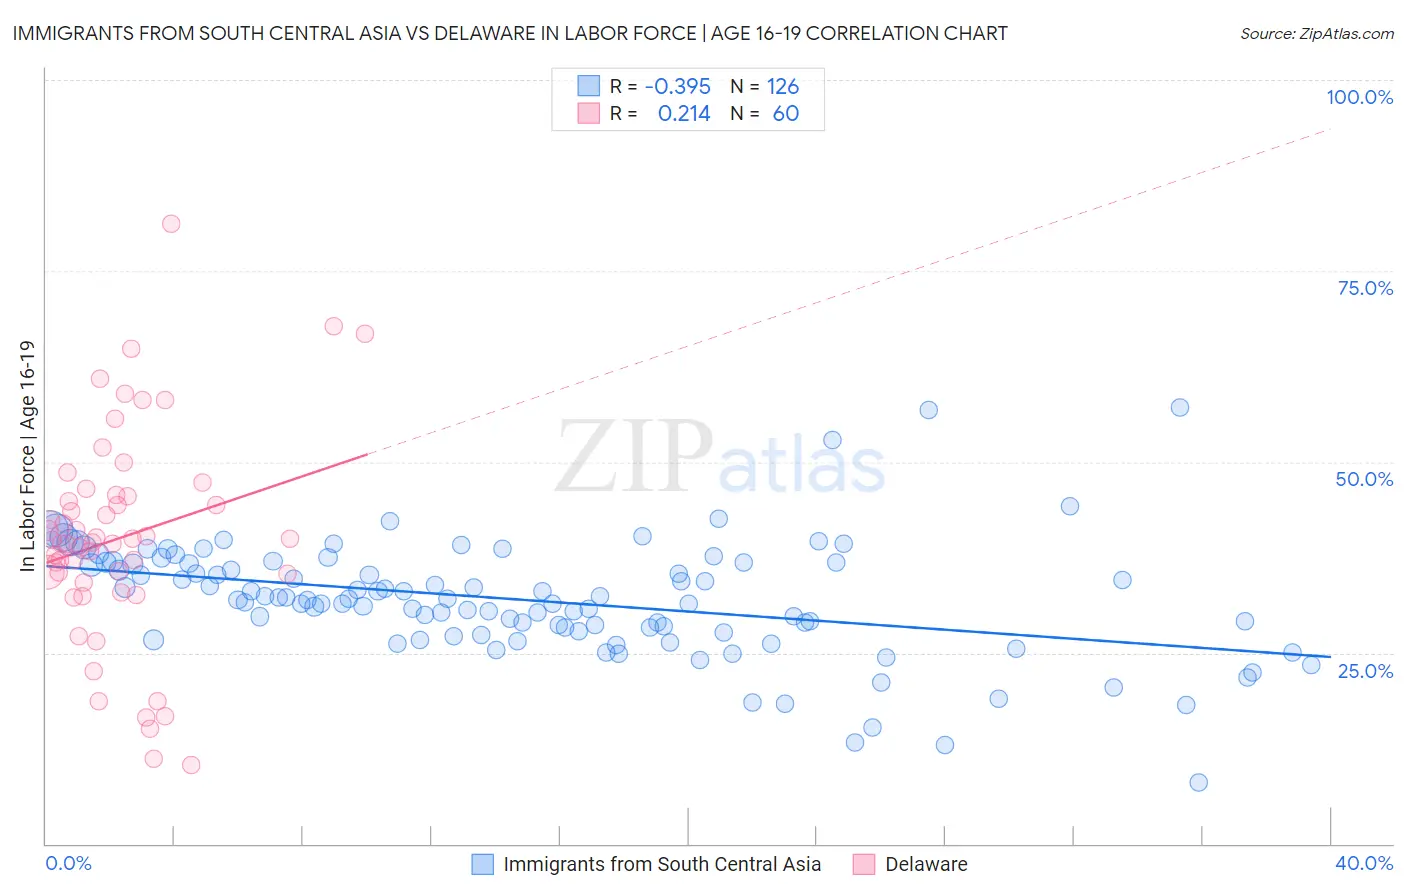
Immigrants from South Central Asia vs Delaware In Labor Force | Age 16-19 Correlation Chart
The statistical analysis conducted on geographies consisting of 472,115,332 people shows a mild negative correlation between the proportion of Immigrants from South Central Asia and labor force participation rate among population between the ages 16 and 19 in the United States with a correlation coefficient (R) of -0.395 and weighted average of 34.6%. Similarly, the statistical analysis conducted on geographies consisting of 96,193,348 people shows a weak positive correlation between the proportion of Delaware and labor force participation rate among population between the ages 16 and 19 in the United States with a correlation coefficient (R) of 0.214 and weighted average of 38.6%, a difference of 11.7%.
In Labor Force | Age 16-19 Correlation Summary
| Measurement | Immigrants from South Central Asia | Delaware |
| Minimum | 8.1% | 10.3% |
| Maximum | 57.1% | 81.2% |
| Range | 49.0% | 70.9% |
| Mean | 31.9% | 40.1% |
| Median | 32.0% | 39.6% |
| Interquartile 25% (IQ1) | 27.9% | 34.7% |
| Interquartile 75% (IQ3) | 36.8% | 45.6% |
| Interquartile Range (IQR) | 8.9% | 10.9% |
| Standard Deviation (Sample) | 7.5% | 13.9% |
| Standard Deviation (Population) | 7.5% | 13.8% |
Similar Demographics by In Labor Force | Age 16-19
Demographics Similar to Immigrants from South Central Asia by In Labor Force | Age 16-19
In terms of in labor force | age 16-19, the demographic groups most similar to Immigrants from South Central Asia are Immigrants from Egypt (34.6%, a difference of 0.010%), Thai (34.6%, a difference of 0.010%), Immigrants (34.6%, a difference of 0.030%), Peruvian (34.6%, a difference of 0.11%), and Egyptian (34.5%, a difference of 0.11%).
| Demographics | Rating | Rank | In Labor Force | Age 16-19 |
| Immigrants | Ukraine | 2.2 /100 | #249 | Tragic 34.8% |
| Immigrants | Pakistan | 2.0 /100 | #250 | Tragic 34.8% |
| Immigrants | Western Asia | 2.0 /100 | #251 | Tragic 34.8% |
| Immigrants | Chile | 2.0 /100 | #252 | Tragic 34.8% |
| Immigrants | Japan | 1.5 /100 | #253 | Tragic 34.7% |
| Bahamians | 1.4 /100 | #254 | Tragic 34.6% |
| Peruvians | 1.4 /100 | #255 | Tragic 34.6% |
| Immigrants | South Central Asia | 1.3 /100 | #256 | Tragic 34.6% |
| Immigrants | Egypt | 1.2 /100 | #257 | Tragic 34.6% |
| Thais | 1.2 /100 | #258 | Tragic 34.6% |
| Immigrants | Immigrants | 1.2 /100 | #259 | Tragic 34.6% |
| Egyptians | 1.2 /100 | #260 | Tragic 34.5% |
| Salvadorans | 1.1 /100 | #261 | Tragic 34.5% |
| Hispanics or Latinos | 1.1 /100 | #262 | Tragic 34.5% |
| Burmese | 1.1 /100 | #263 | Tragic 34.5% |
Demographics Similar to Delaware by In Labor Force | Age 16-19
In terms of in labor force | age 16-19, the demographic groups most similar to Delaware are Iraqi (38.6%, a difference of 0.020%), Chinese (38.6%, a difference of 0.030%), Immigrants from Ethiopia (38.6%, a difference of 0.13%), Lebanese (38.6%, a difference of 0.13%), and Immigrants from Eritrea (38.7%, a difference of 0.17%).
| Demographics | Rating | Rank | In Labor Force | Age 16-19 |
| Immigrants | North Macedonia | 99.3 /100 | #99 | Exceptional 38.9% |
| Immigrants | Thailand | 99.1 /100 | #100 | Exceptional 38.7% |
| Hmong | 99.1 /100 | #101 | Exceptional 38.7% |
| Zimbabweans | 99.1 /100 | #102 | Exceptional 38.7% |
| Immigrants | Cameroon | 99.0 /100 | #103 | Exceptional 38.7% |
| Immigrants | Eritrea | 99.0 /100 | #104 | Exceptional 38.7% |
| Iraqis | 98.9 /100 | #105 | Exceptional 38.6% |
| Delaware | 98.8 /100 | #106 | Exceptional 38.6% |
| Chinese | 98.8 /100 | #107 | Exceptional 38.6% |
| Immigrants | Ethiopia | 98.7 /100 | #108 | Exceptional 38.6% |
| Lebanese | 98.7 /100 | #109 | Exceptional 38.6% |
| Maltese | 98.6 /100 | #110 | Exceptional 38.5% |
| Crow | 98.5 /100 | #111 | Exceptional 38.5% |
| Immigrants | Scotland | 98.5 /100 | #112 | Exceptional 38.5% |
| Sub-Saharan Africans | 98.3 /100 | #113 | Exceptional 38.4% |