Latvian vs Immigrants from Uruguay In Labor Force | Age 16-19
COMPARE
Latvian
Immigrants from Uruguay
In Labor Force | Age 16-19
In Labor Force | Age 16-19 Comparison
Latvians
Immigrants from Uruguay
38.9%
IN LABOR FORCE | AGE 16-19
99.4/ 100
METRIC RATING
96th/ 347
METRIC RANK
34.4%
IN LABOR FORCE | AGE 16-19
0.9/ 100
METRIC RATING
264th/ 347
METRIC RANK
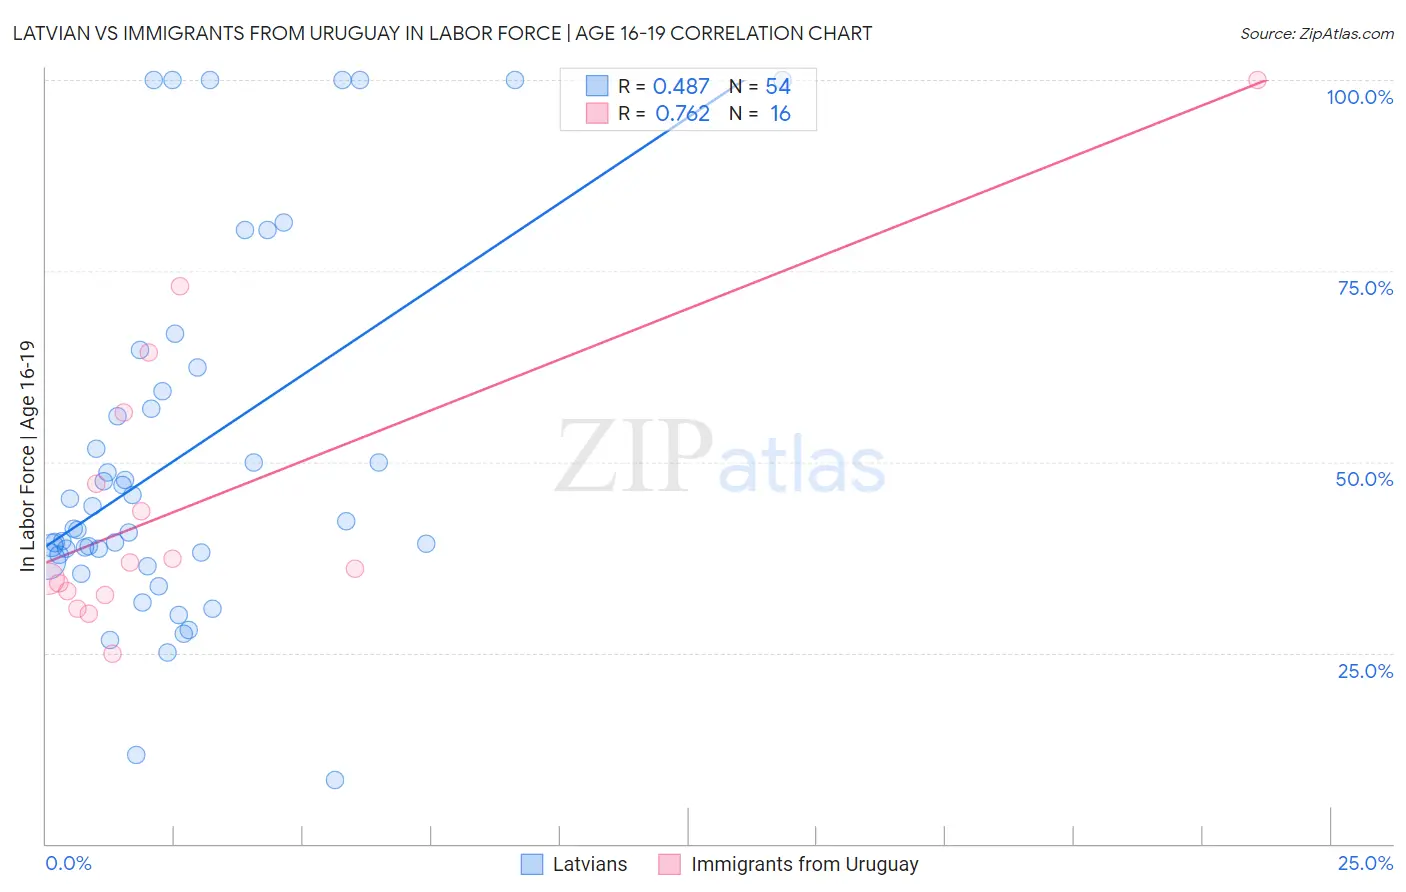
Latvian vs Immigrants from Uruguay In Labor Force | Age 16-19 Correlation Chart
The statistical analysis conducted on geographies consisting of 220,454,154 people shows a moderate positive correlation between the proportion of Latvians and labor force participation rate among population between the ages 16 and 19 in the United States with a correlation coefficient (R) of 0.487 and weighted average of 38.9%. Similarly, the statistical analysis conducted on geographies consisting of 133,181,589 people shows a strong positive correlation between the proportion of Immigrants from Uruguay and labor force participation rate among population between the ages 16 and 19 in the United States with a correlation coefficient (R) of 0.762 and weighted average of 34.4%, a difference of 13.1%.
In Labor Force | Age 16-19 Correlation Summary
| Measurement | Latvian | Immigrants from Uruguay |
| Minimum | 8.4% | 24.8% |
| Maximum | 100.0% | 100.0% |
| Range | 91.6% | 75.2% |
| Mean | 50.8% | 44.7% |
| Median | 41.8% | 36.4% |
| Interquartile 25% (IQ1) | 37.8% | 32.8% |
| Interquartile 75% (IQ3) | 59.2% | 51.8% |
| Interquartile Range (IQR) | 21.4% | 19.0% |
| Standard Deviation (Sample) | 23.9% | 19.8% |
| Standard Deviation (Population) | 23.6% | 19.2% |
Similar Demographics by In Labor Force | Age 16-19
Demographics Similar to Latvians by In Labor Force | Age 16-19
In terms of in labor force | age 16-19, the demographic groups most similar to Latvians are Immigrants from North America (38.9%, a difference of 0.030%), Greek (38.9%, a difference of 0.040%), Ugandan (38.9%, a difference of 0.050%), Immigrants from North Macedonia (38.9%, a difference of 0.070%), and Immigrants from Canada (38.9%, a difference of 0.12%).
| Demographics | Rating | Rank | In Labor Force | Age 16-19 |
| Alaska Natives | 99.6 /100 | #89 | Exceptional 39.1% |
| Immigrants | Burma/Myanmar | 99.5 /100 | #90 | Exceptional 39.0% |
| Spanish Americans | 99.5 /100 | #91 | Exceptional 39.0% |
| Osage | 99.4 /100 | #92 | Exceptional 39.0% |
| Blackfeet | 99.4 /100 | #93 | Exceptional 38.9% |
| Immigrants | Canada | 99.4 /100 | #94 | Exceptional 38.9% |
| Immigrants | North America | 99.4 /100 | #95 | Exceptional 38.9% |
| Latvians | 99.4 /100 | #96 | Exceptional 38.9% |
| Greeks | 99.3 /100 | #97 | Exceptional 38.9% |
| Ugandans | 99.3 /100 | #98 | Exceptional 38.9% |
| Immigrants | North Macedonia | 99.3 /100 | #99 | Exceptional 38.9% |
| Immigrants | Thailand | 99.1 /100 | #100 | Exceptional 38.7% |
| Hmong | 99.1 /100 | #101 | Exceptional 38.7% |
| Zimbabweans | 99.1 /100 | #102 | Exceptional 38.7% |
| Immigrants | Cameroon | 99.0 /100 | #103 | Exceptional 38.7% |
Demographics Similar to Immigrants from Uruguay by In Labor Force | Age 16-19
In terms of in labor force | age 16-19, the demographic groups most similar to Immigrants from Uruguay are Immigrants from El Salvador (34.3%, a difference of 0.24%), Burmese (34.5%, a difference of 0.28%), Hispanic or Latino (34.5%, a difference of 0.32%), Salvadoran (34.5%, a difference of 0.33%), and Immigrants from Malaysia (34.3%, a difference of 0.33%).
| Demographics | Rating | Rank | In Labor Force | Age 16-19 |
| Immigrants | Egypt | 1.2 /100 | #257 | Tragic 34.6% |
| Thais | 1.2 /100 | #258 | Tragic 34.6% |
| Immigrants | Immigrants | 1.2 /100 | #259 | Tragic 34.6% |
| Egyptians | 1.2 /100 | #260 | Tragic 34.5% |
| Salvadorans | 1.1 /100 | #261 | Tragic 34.5% |
| Hispanics or Latinos | 1.1 /100 | #262 | Tragic 34.5% |
| Burmese | 1.1 /100 | #263 | Tragic 34.5% |
| Immigrants | Uruguay | 0.9 /100 | #264 | Tragic 34.4% |
| Immigrants | El Salvador | 0.7 /100 | #265 | Tragic 34.3% |
| Immigrants | Malaysia | 0.7 /100 | #266 | Tragic 34.3% |
| Immigrants | Peru | 0.5 /100 | #267 | Tragic 34.2% |
| Immigrants | Asia | 0.5 /100 | #268 | Tragic 34.1% |
| Pima | 0.5 /100 | #269 | Tragic 34.1% |
| Immigrants | Russia | 0.4 /100 | #270 | Tragic 34.1% |
| Central American Indians | 0.4 /100 | #271 | Tragic 34.1% |