Tongan vs Colville In Labor Force | Age 20-24
COMPARE
Tongan
Colville
In Labor Force | Age 20-24
In Labor Force | Age 20-24 Comparison
Tongans
Colville
77.9%
IN LABOR FORCE | AGE 20-24
100.0/ 100
METRIC RATING
26th/ 347
METRIC RANK
73.9%
IN LABOR FORCE | AGE 20-24
1.5/ 100
METRIC RATING
247th/ 347
METRIC RANK
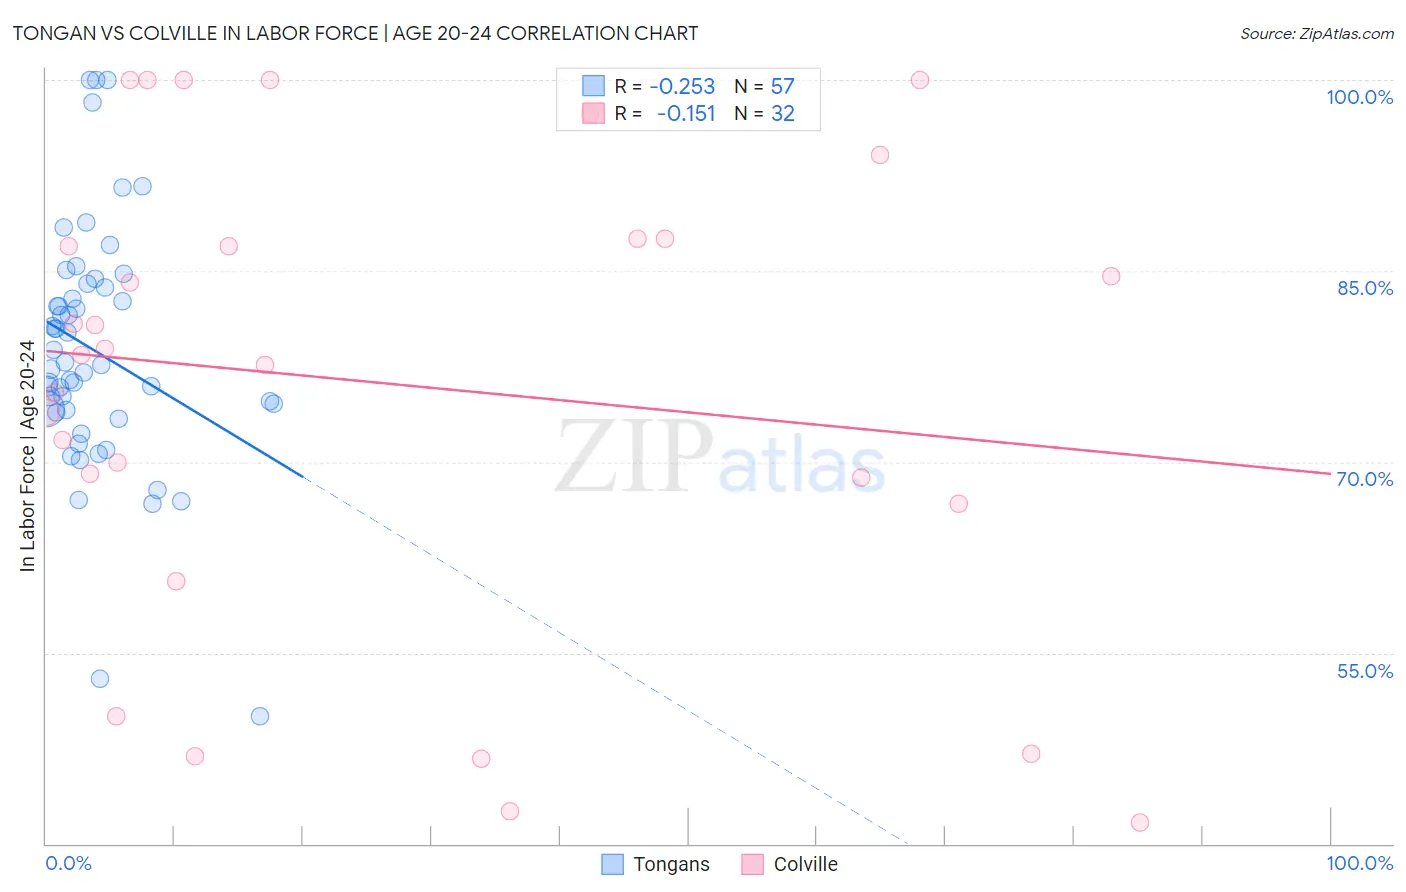
Tongan vs Colville In Labor Force | Age 20-24 Correlation Chart
The statistical analysis conducted on geographies consisting of 102,904,168 people shows a weak negative correlation between the proportion of Tongans and labor force participation rate among population between the ages 20 and 24 in the United States with a correlation coefficient (R) of -0.253 and weighted average of 77.9%. Similarly, the statistical analysis conducted on geographies consisting of 34,682,929 people shows a poor negative correlation between the proportion of Colville and labor force participation rate among population between the ages 20 and 24 in the United States with a correlation coefficient (R) of -0.151 and weighted average of 73.9%, a difference of 5.4%.
In Labor Force | Age 20-24 Correlation Summary
| Measurement | Tongan | Colville |
| Minimum | 50.0% | 41.7% |
| Maximum | 100.0% | 100.0% |
| Range | 50.0% | 58.3% |
| Mean | 78.7% | 76.1% |
| Median | 77.6% | 78.6% |
| Interquartile 25% (IQ1) | 74.0% | 67.7% |
| Interquartile 75% (IQ3) | 83.8% | 87.5% |
| Interquartile Range (IQR) | 9.8% | 19.8% |
| Standard Deviation (Sample) | 9.7% | 18.3% |
| Standard Deviation (Population) | 9.6% | 18.0% |
Similar Demographics by In Labor Force | Age 20-24
Demographics Similar to Tongans by In Labor Force | Age 20-24
In terms of in labor force | age 20-24, the demographic groups most similar to Tongans are Tlingit-Haida (77.9%, a difference of 0.020%), Yugoslavian (78.0%, a difference of 0.060%), Liberian (78.0%, a difference of 0.060%), Pennsylvania German (78.0%, a difference of 0.070%), and Immigrants from Micronesia (77.8%, a difference of 0.12%).
| Demographics | Rating | Rank | In Labor Force | Age 20-24 |
| Bangladeshis | 100.0 /100 | #19 | Exceptional 78.1% |
| French Canadians | 100.0 /100 | #20 | Exceptional 78.1% |
| Puget Sound Salish | 100.0 /100 | #21 | Exceptional 78.0% |
| Pennsylvania Germans | 100.0 /100 | #22 | Exceptional 78.0% |
| Yugoslavians | 100.0 /100 | #23 | Exceptional 78.0% |
| Liberians | 100.0 /100 | #24 | Exceptional 78.0% |
| Tlingit-Haida | 100.0 /100 | #25 | Exceptional 77.9% |
| Tongans | 100.0 /100 | #26 | Exceptional 77.9% |
| Immigrants | Micronesia | 100.0 /100 | #27 | Exceptional 77.8% |
| Belgians | 100.0 /100 | #28 | Exceptional 77.8% |
| Slovaks | 100.0 /100 | #29 | Exceptional 77.7% |
| Swiss | 100.0 /100 | #30 | Exceptional 77.7% |
| Poles | 100.0 /100 | #31 | Exceptional 77.6% |
| English | 100.0 /100 | #32 | Exceptional 77.6% |
| Immigrants | Ethiopia | 100.0 /100 | #33 | Exceptional 77.5% |
Demographics Similar to Colville by In Labor Force | Age 20-24
In terms of in labor force | age 20-24, the demographic groups most similar to Colville are Immigrants from Saudi Arabia (73.9%, a difference of 0.0%), Immigrants from Panama (73.9%, a difference of 0.030%), Black/African American (73.9%, a difference of 0.050%), Immigrants from Belgium (73.9%, a difference of 0.060%), and Turkish (73.9%, a difference of 0.070%).
| Demographics | Rating | Rank | In Labor Force | Age 20-24 |
| Immigrants | Sri Lanka | 2.3 /100 | #240 | Tragic 74.0% |
| Immigrants | Senegal | 2.1 /100 | #241 | Tragic 74.0% |
| Thais | 2.1 /100 | #242 | Tragic 74.0% |
| Immigrants | Syria | 1.9 /100 | #243 | Tragic 74.0% |
| Immigrants | South Central Asia | 1.9 /100 | #244 | Tragic 74.0% |
| Turks | 1.8 /100 | #245 | Tragic 73.9% |
| Immigrants | Panama | 1.6 /100 | #246 | Tragic 73.9% |
| Colville | 1.5 /100 | #247 | Tragic 73.9% |
| Immigrants | Saudi Arabia | 1.5 /100 | #248 | Tragic 73.9% |
| Blacks/African Americans | 1.3 /100 | #249 | Tragic 73.9% |
| Immigrants | Belgium | 1.3 /100 | #250 | Tragic 73.9% |
| Immigrants | Egypt | 1.2 /100 | #251 | Tragic 73.8% |
| Immigrants | Kazakhstan | 1.1 /100 | #252 | Tragic 73.8% |
| Arapaho | 1.0 /100 | #253 | Tragic 73.8% |
| Ute | 1.0 /100 | #254 | Tragic 73.8% |