Ute vs Colville In Labor Force | Age 20-24
COMPARE
Ute
Colville
In Labor Force | Age 20-24
In Labor Force | Age 20-24 Comparison
Ute
Colville
73.8%
IN LABOR FORCE | AGE 20-24
1.0/ 100
METRIC RATING
254th/ 347
METRIC RANK
73.9%
IN LABOR FORCE | AGE 20-24
1.5/ 100
METRIC RATING
247th/ 347
METRIC RANK
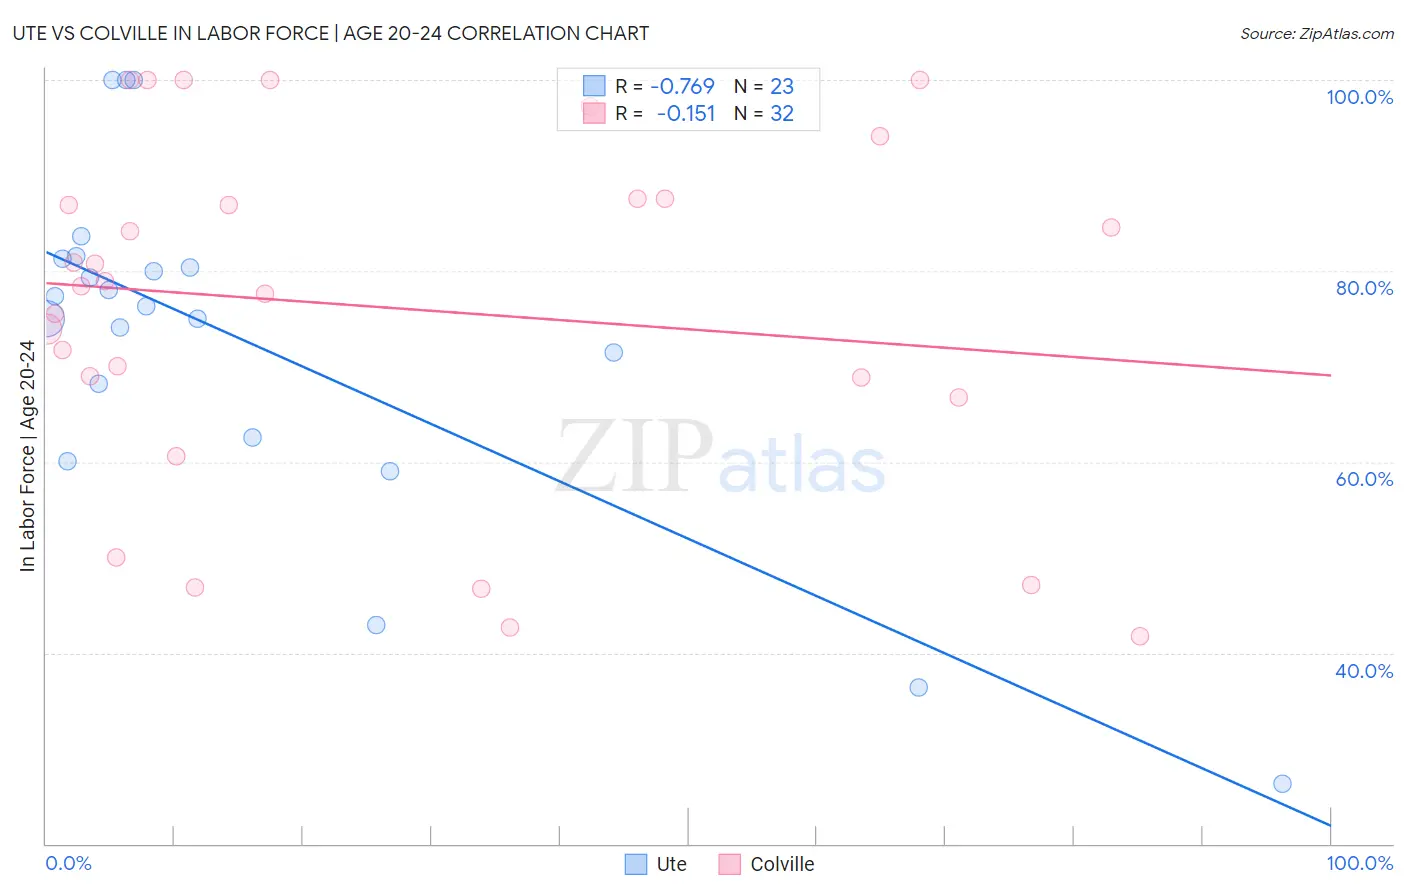
Ute vs Colville In Labor Force | Age 20-24 Correlation Chart
The statistical analysis conducted on geographies consisting of 55,663,255 people shows a strong negative correlation between the proportion of Ute and labor force participation rate among population between the ages 20 and 24 in the United States with a correlation coefficient (R) of -0.769 and weighted average of 73.8%. Similarly, the statistical analysis conducted on geographies consisting of 34,682,929 people shows a poor negative correlation between the proportion of Colville and labor force participation rate among population between the ages 20 and 24 in the United States with a correlation coefficient (R) of -0.151 and weighted average of 73.9%, a difference of 0.15%.
In Labor Force | Age 20-24 Correlation Summary
| Measurement | Ute | Colville |
| Minimum | 26.3% | 41.7% |
| Maximum | 100.0% | 100.0% |
| Range | 73.7% | 58.3% |
| Mean | 72.5% | 76.1% |
| Median | 76.4% | 78.6% |
| Interquartile 25% (IQ1) | 62.5% | 67.7% |
| Interquartile 75% (IQ3) | 81.3% | 87.5% |
| Interquartile Range (IQR) | 18.8% | 19.8% |
| Standard Deviation (Sample) | 18.6% | 18.3% |
| Standard Deviation (Population) | 18.1% | 18.0% |
Demographics Similar to Ute and Colville by In Labor Force | Age 20-24
In terms of in labor force | age 20-24, the demographic groups most similar to Ute are Arapaho (73.8%, a difference of 0.0%), Immigrants from Pakistan (73.8%, a difference of 0.020%), Immigrants from Kazakhstan (73.8%, a difference of 0.050%), Immigrants from Egypt (73.8%, a difference of 0.070%), and Spanish American Indian (73.7%, a difference of 0.070%). Similarly, the demographic groups most similar to Colville are Immigrants from Saudi Arabia (73.9%, a difference of 0.0%), Immigrants from Panama (73.9%, a difference of 0.030%), Black/African American (73.9%, a difference of 0.050%), Immigrants from Belgium (73.9%, a difference of 0.060%), and Turkish (73.9%, a difference of 0.070%).
| Demographics | Rating | Rank | In Labor Force | Age 20-24 |
| Immigrants | Sri Lanka | 2.3 /100 | #240 | Tragic 74.0% |
| Immigrants | Senegal | 2.1 /100 | #241 | Tragic 74.0% |
| Thais | 2.1 /100 | #242 | Tragic 74.0% |
| Immigrants | Syria | 1.9 /100 | #243 | Tragic 74.0% |
| Immigrants | South Central Asia | 1.9 /100 | #244 | Tragic 74.0% |
| Turks | 1.8 /100 | #245 | Tragic 73.9% |
| Immigrants | Panama | 1.6 /100 | #246 | Tragic 73.9% |
| Colville | 1.5 /100 | #247 | Tragic 73.9% |
| Immigrants | Saudi Arabia | 1.5 /100 | #248 | Tragic 73.9% |
| Blacks/African Americans | 1.3 /100 | #249 | Tragic 73.9% |
| Immigrants | Belgium | 1.3 /100 | #250 | Tragic 73.9% |
| Immigrants | Egypt | 1.2 /100 | #251 | Tragic 73.8% |
| Immigrants | Kazakhstan | 1.1 /100 | #252 | Tragic 73.8% |
| Arapaho | 1.0 /100 | #253 | Tragic 73.8% |
| Ute | 1.0 /100 | #254 | Tragic 73.8% |
| Immigrants | Pakistan | 0.9 /100 | #255 | Tragic 73.8% |
| Spanish American Indians | 0.8 /100 | #256 | Tragic 73.7% |
| Paraguayans | 0.8 /100 | #257 | Tragic 73.7% |
| Egyptians | 0.7 /100 | #258 | Tragic 73.7% |
| Dutch West Indians | 0.7 /100 | #259 | Tragic 73.7% |
| Immigrants | Turkey | 0.7 /100 | #260 | Tragic 73.7% |