Indonesian vs Swedish In Labor Force | Age 20-24
COMPARE
Indonesian
Swedish
In Labor Force | Age 20-24
In Labor Force | Age 20-24 Comparison
Indonesians
Swedes
77.2%
IN LABOR FORCE | AGE 20-24
100.0/ 100
METRIC RATING
52nd/ 347
METRIC RANK
78.8%
IN LABOR FORCE | AGE 20-24
100.0/ 100
METRIC RATING
9th/ 347
METRIC RANK
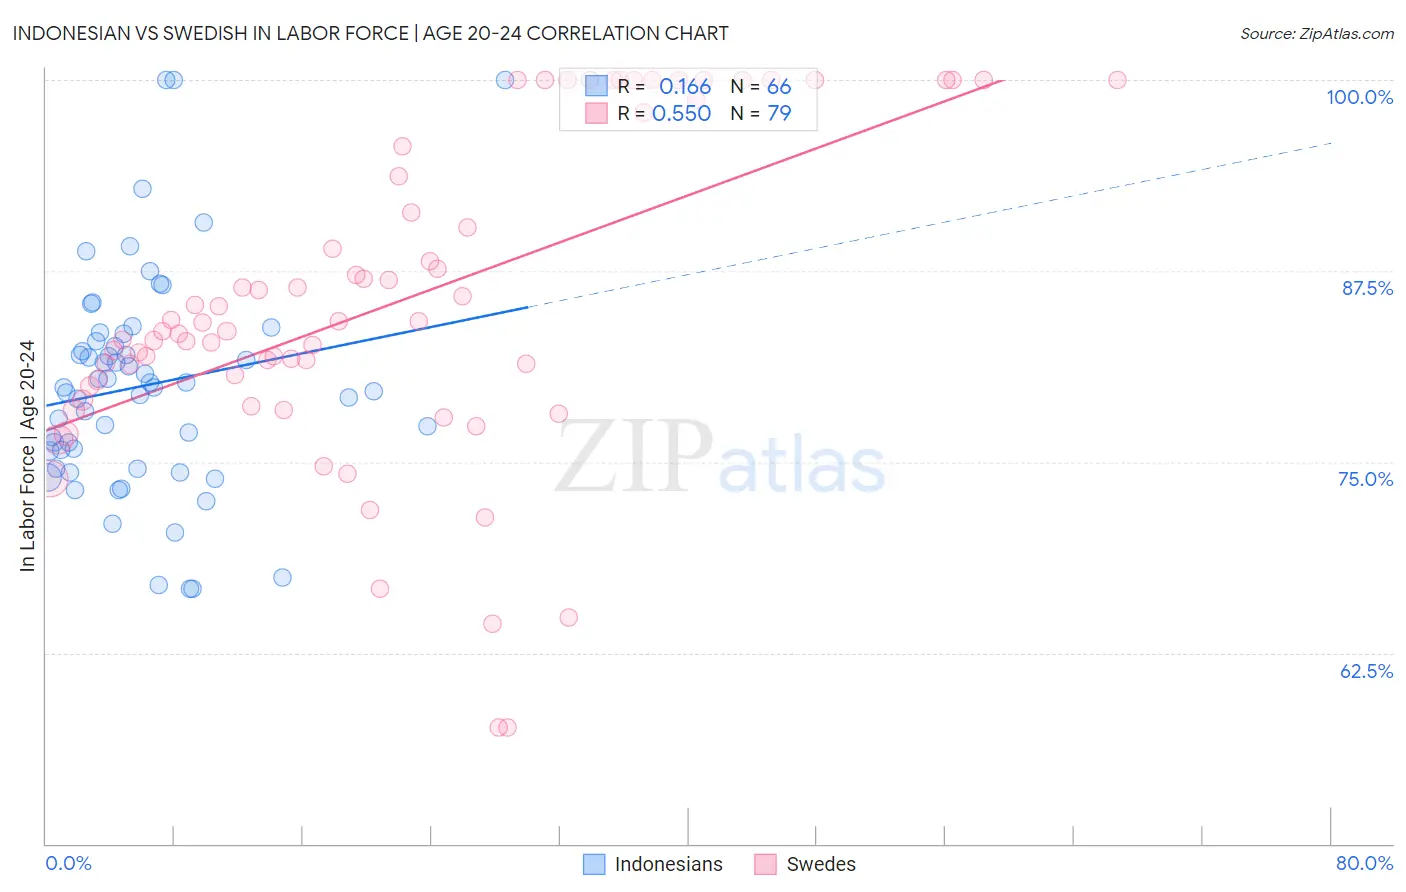
Indonesian vs Swedish In Labor Force | Age 20-24 Correlation Chart
The statistical analysis conducted on geographies consisting of 162,737,934 people shows a poor positive correlation between the proportion of Indonesians and labor force participation rate among population between the ages 20 and 24 in the United States with a correlation coefficient (R) of 0.166 and weighted average of 77.2%. Similarly, the statistical analysis conducted on geographies consisting of 538,164,941 people shows a substantial positive correlation between the proportion of Swedes and labor force participation rate among population between the ages 20 and 24 in the United States with a correlation coefficient (R) of 0.550 and weighted average of 78.8%, a difference of 2.1%.
In Labor Force | Age 20-24 Correlation Summary
| Measurement | Indonesian | Swedish |
| Minimum | 66.7% | 57.6% |
| Maximum | 100.0% | 100.0% |
| Range | 33.3% | 42.4% |
| Mean | 80.0% | 85.4% |
| Median | 79.9% | 83.6% |
| Interquartile 25% (IQ1) | 75.7% | 80.0% |
| Interquartile 75% (IQ3) | 82.9% | 95.6% |
| Interquartile Range (IQR) | 7.2% | 15.7% |
| Standard Deviation (Sample) | 7.1% | 10.4% |
| Standard Deviation (Population) | 7.1% | 10.4% |
Similar Demographics by In Labor Force | Age 20-24
Demographics Similar to Indonesians by In Labor Force | Age 20-24
In terms of in labor force | age 20-24, the demographic groups most similar to Indonesians are Croatian (77.2%, a difference of 0.010%), Immigrants from the Azores (77.2%, a difference of 0.010%), Malaysian (77.2%, a difference of 0.020%), Serbian (77.3%, a difference of 0.060%), and Chinese (77.3%, a difference of 0.060%).
| Demographics | Rating | Rank | In Labor Force | Age 20-24 |
| Native Hawaiians | 100.0 /100 | #45 | Exceptional 77.4% |
| Samoans | 100.0 /100 | #46 | Exceptional 77.4% |
| Ethiopians | 100.0 /100 | #47 | Exceptional 77.3% |
| Serbians | 100.0 /100 | #48 | Exceptional 77.3% |
| Chinese | 100.0 /100 | #49 | Exceptional 77.3% |
| Malaysians | 100.0 /100 | #50 | Exceptional 77.2% |
| Croatians | 100.0 /100 | #51 | Exceptional 77.2% |
| Indonesians | 100.0 /100 | #52 | Exceptional 77.2% |
| Immigrants | Azores | 100.0 /100 | #53 | Exceptional 77.2% |
| Celtics | 99.9 /100 | #54 | Exceptional 77.1% |
| Immigrants | Liberia | 99.9 /100 | #55 | Exceptional 77.1% |
| Europeans | 99.9 /100 | #56 | Exceptional 77.1% |
| Chippewa | 99.9 /100 | #57 | Exceptional 77.1% |
| Hawaiians | 99.9 /100 | #58 | Exceptional 77.0% |
| Scotch-Irish | 99.9 /100 | #59 | Exceptional 77.0% |
Demographics Similar to Swedes by In Labor Force | Age 20-24
In terms of in labor force | age 20-24, the demographic groups most similar to Swedes are Immigrants from Cabo Verde (78.9%, a difference of 0.070%), Slovene (78.7%, a difference of 0.16%), Luxembourger (79.0%, a difference of 0.17%), Finnish (78.7%, a difference of 0.19%), and Danish (79.0%, a difference of 0.21%).
| Demographics | Rating | Rank | In Labor Force | Age 20-24 |
| Immigrants | Somalia | 100.0 /100 | #2 | Exceptional 79.5% |
| Somalis | 100.0 /100 | #3 | Exceptional 79.3% |
| Alaskan Athabascans | 100.0 /100 | #4 | Exceptional 79.1% |
| Aleuts | 100.0 /100 | #5 | Exceptional 79.0% |
| Danes | 100.0 /100 | #6 | Exceptional 79.0% |
| Luxembourgers | 100.0 /100 | #7 | Exceptional 79.0% |
| Immigrants | Cabo Verde | 100.0 /100 | #8 | Exceptional 78.9% |
| Swedes | 100.0 /100 | #9 | Exceptional 78.8% |
| Slovenes | 100.0 /100 | #10 | Exceptional 78.7% |
| Finns | 100.0 /100 | #11 | Exceptional 78.7% |
| Germans | 100.0 /100 | #12 | Exceptional 78.6% |
| Scandinavians | 100.0 /100 | #13 | Exceptional 78.5% |
| Czechs | 100.0 /100 | #14 | Exceptional 78.5% |
| Sudanese | 100.0 /100 | #15 | Exceptional 78.4% |
| Dutch | 100.0 /100 | #16 | Exceptional 78.4% |