Icelander vs Colville In Labor Force | Age 20-24
COMPARE
Icelander
Colville
In Labor Force | Age 20-24
In Labor Force | Age 20-24 Comparison
Icelanders
Colville
76.9%
IN LABOR FORCE | AGE 20-24
99.9/ 100
METRIC RATING
66th/ 347
METRIC RANK
73.9%
IN LABOR FORCE | AGE 20-24
1.5/ 100
METRIC RATING
247th/ 347
METRIC RANK
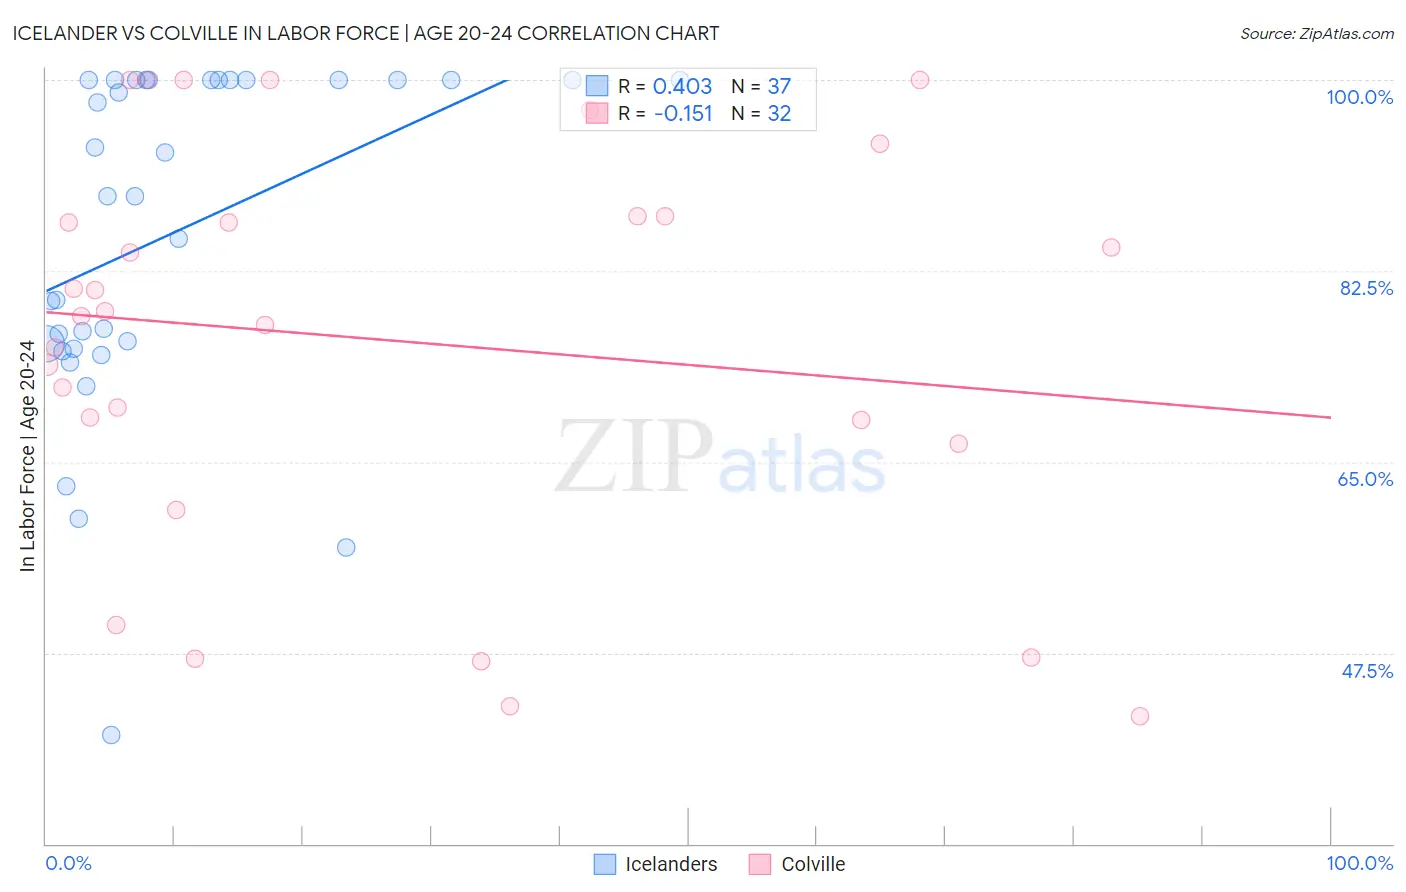
Icelander vs Colville In Labor Force | Age 20-24 Correlation Chart
The statistical analysis conducted on geographies consisting of 159,597,296 people shows a moderate positive correlation between the proportion of Icelanders and labor force participation rate among population between the ages 20 and 24 in the United States with a correlation coefficient (R) of 0.403 and weighted average of 76.9%. Similarly, the statistical analysis conducted on geographies consisting of 34,682,929 people shows a poor negative correlation between the proportion of Colville and labor force participation rate among population between the ages 20 and 24 in the United States with a correlation coefficient (R) of -0.151 and weighted average of 73.9%, a difference of 4.0%.
In Labor Force | Age 20-24 Correlation Summary
| Measurement | Icelander | Colville |
| Minimum | 40.0% | 41.7% |
| Maximum | 100.0% | 100.0% |
| Range | 60.0% | 58.3% |
| Mean | 86.0% | 76.1% |
| Median | 89.3% | 78.6% |
| Interquartile 25% (IQ1) | 75.6% | 67.7% |
| Interquartile 75% (IQ3) | 100.0% | 87.5% |
| Interquartile Range (IQR) | 24.4% | 19.8% |
| Standard Deviation (Sample) | 15.4% | 18.3% |
| Standard Deviation (Population) | 15.2% | 18.0% |
Similar Demographics by In Labor Force | Age 20-24
Demographics Similar to Icelanders by In Labor Force | Age 20-24
In terms of in labor force | age 20-24, the demographic groups most similar to Icelanders are Slavic (76.9%, a difference of 0.010%), Crow (76.9%, a difference of 0.020%), French American Indian (76.8%, a difference of 0.040%), Immigrants from Sudan (76.8%, a difference of 0.060%), and White/Caucasian (76.9%, a difference of 0.070%).
| Demographics | Rating | Rank | In Labor Force | Age 20-24 |
| Scotch-Irish | 99.9 /100 | #59 | Exceptional 77.0% |
| Kenyans | 99.9 /100 | #60 | Exceptional 77.0% |
| Immigrants | Eritrea | 99.9 /100 | #61 | Exceptional 77.0% |
| Immigrants | Kenya | 99.9 /100 | #62 | Exceptional 77.0% |
| Lithuanians | 99.9 /100 | #63 | Exceptional 77.0% |
| Whites/Caucasians | 99.9 /100 | #64 | Exceptional 76.9% |
| Crow | 99.9 /100 | #65 | Exceptional 76.9% |
| Icelanders | 99.9 /100 | #66 | Exceptional 76.9% |
| Slavs | 99.9 /100 | #67 | Exceptional 76.9% |
| French American Indians | 99.8 /100 | #68 | Exceptional 76.8% |
| Immigrants | Sudan | 99.8 /100 | #69 | Exceptional 76.8% |
| Ottawa | 99.8 /100 | #70 | Exceptional 76.8% |
| Northern Europeans | 99.8 /100 | #71 | Exceptional 76.8% |
| Guamanians/Chamorros | 99.8 /100 | #72 | Exceptional 76.7% |
| British | 99.8 /100 | #73 | Exceptional 76.7% |
Demographics Similar to Colville by In Labor Force | Age 20-24
In terms of in labor force | age 20-24, the demographic groups most similar to Colville are Immigrants from Saudi Arabia (73.9%, a difference of 0.0%), Immigrants from Panama (73.9%, a difference of 0.030%), Black/African American (73.9%, a difference of 0.050%), Immigrants from Belgium (73.9%, a difference of 0.060%), and Turkish (73.9%, a difference of 0.070%).
| Demographics | Rating | Rank | In Labor Force | Age 20-24 |
| Immigrants | Sri Lanka | 2.3 /100 | #240 | Tragic 74.0% |
| Immigrants | Senegal | 2.1 /100 | #241 | Tragic 74.0% |
| Thais | 2.1 /100 | #242 | Tragic 74.0% |
| Immigrants | Syria | 1.9 /100 | #243 | Tragic 74.0% |
| Immigrants | South Central Asia | 1.9 /100 | #244 | Tragic 74.0% |
| Turks | 1.8 /100 | #245 | Tragic 73.9% |
| Immigrants | Panama | 1.6 /100 | #246 | Tragic 73.9% |
| Colville | 1.5 /100 | #247 | Tragic 73.9% |
| Immigrants | Saudi Arabia | 1.5 /100 | #248 | Tragic 73.9% |
| Blacks/African Americans | 1.3 /100 | #249 | Tragic 73.9% |
| Immigrants | Belgium | 1.3 /100 | #250 | Tragic 73.9% |
| Immigrants | Egypt | 1.2 /100 | #251 | Tragic 73.8% |
| Immigrants | Kazakhstan | 1.1 /100 | #252 | Tragic 73.8% |
| Arapaho | 1.0 /100 | #253 | Tragic 73.8% |
| Ute | 1.0 /100 | #254 | Tragic 73.8% |