Immigrants from South America vs Chickasaw In Labor Force | Age > 16
COMPARE
Immigrants from South America
Chickasaw
In Labor Force | Age > 16
In Labor Force | Age > 16 Comparison
Immigrants from South America
Chickasaw
66.0%
IN LABOR FORCE | AGE > 16
99.1/ 100
METRIC RATING
93rd/ 347
METRIC RANK
62.3%
IN LABOR FORCE | AGE > 16
0.0/ 100
METRIC RATING
318th/ 347
METRIC RANK
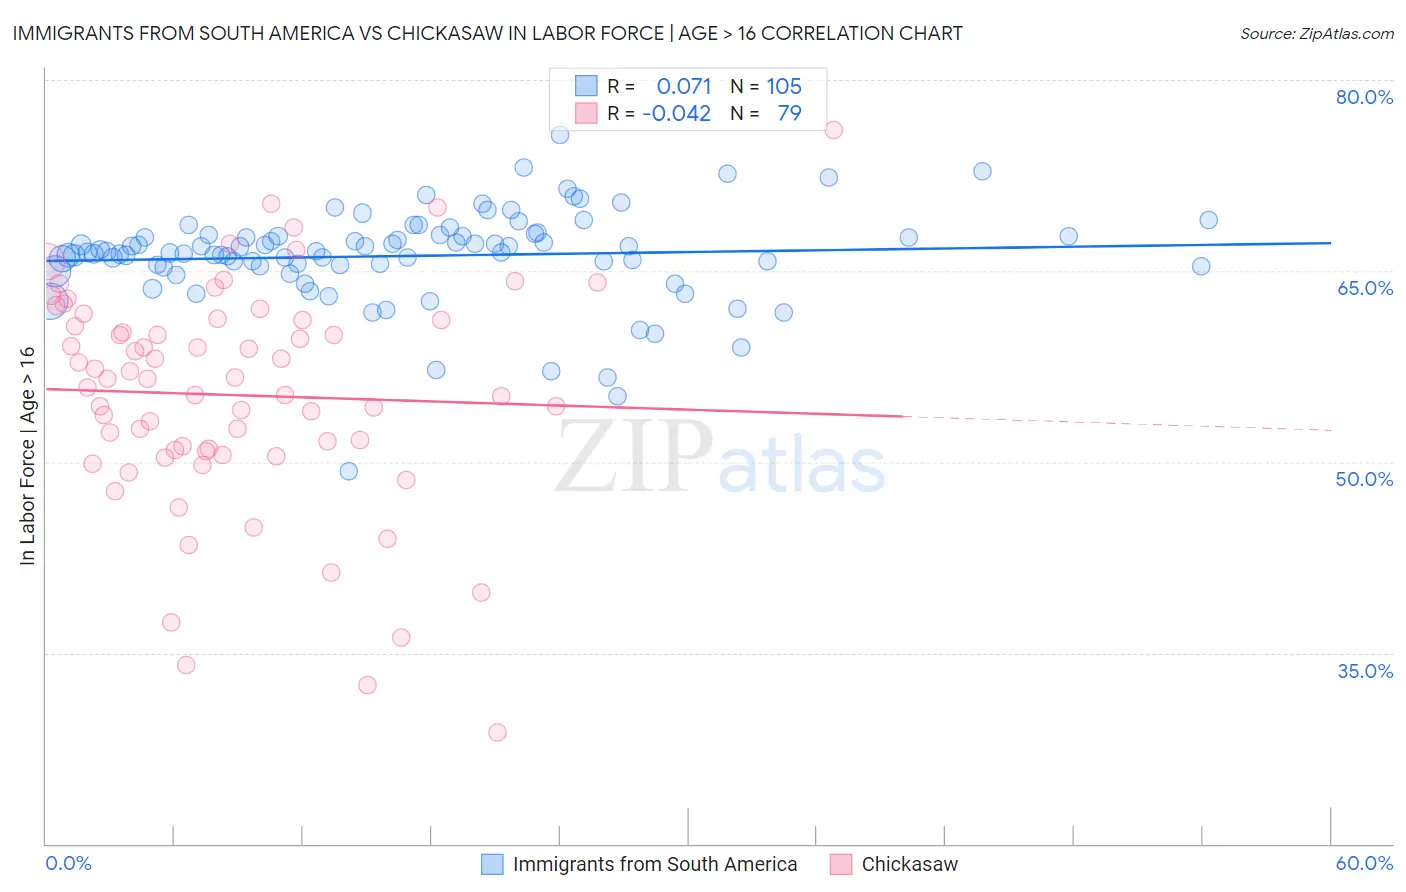
Immigrants from South America vs Chickasaw In Labor Force | Age > 16 Correlation Chart
The statistical analysis conducted on geographies consisting of 486,427,951 people shows a slight positive correlation between the proportion of Immigrants from South America and labor force participation rate among population ages 16 and over in the United States with a correlation coefficient (R) of 0.071 and weighted average of 66.0%. Similarly, the statistical analysis conducted on geographies consisting of 147,722,257 people shows no correlation between the proportion of Chickasaw and labor force participation rate among population ages 16 and over in the United States with a correlation coefficient (R) of -0.042 and weighted average of 62.3%, a difference of 5.9%.
In Labor Force | Age > 16 Correlation Summary
| Measurement | Immigrants from South America | Chickasaw |
| Minimum | 49.2% | 28.7% |
| Maximum | 75.7% | 76.1% |
| Range | 26.5% | 47.4% |
| Mean | 66.2% | 55.2% |
| Median | 66.5% | 56.5% |
| Interquartile 25% (IQ1) | 65.4% | 50.9% |
| Interquartile 75% (IQ3) | 67.8% | 61.1% |
| Interquartile Range (IQR) | 2.4% | 10.2% |
| Standard Deviation (Sample) | 3.8% | 8.9% |
| Standard Deviation (Population) | 3.8% | 8.8% |
Similar Demographics by In Labor Force | Age > 16
Demographics Similar to Immigrants from South America by In Labor Force | Age > 16
In terms of in labor force | age > 16, the demographic groups most similar to Immigrants from South America are Aleut (66.0%, a difference of 0.010%), Immigrants from Cambodia (66.0%, a difference of 0.020%), Immigrants from Uruguay (66.0%, a difference of 0.020%), Immigrants from Laos (66.0%, a difference of 0.030%), and Chilean (66.0%, a difference of 0.030%).
| Demographics | Rating | Rank | In Labor Force | Age > 16 |
| South Americans | 99.4 /100 | #86 | Exceptional 66.0% |
| South American Indians | 99.4 /100 | #87 | Exceptional 66.0% |
| Bermudans | 99.3 /100 | #88 | Exceptional 66.0% |
| Immigrants | Laos | 99.2 /100 | #89 | Exceptional 66.0% |
| Chileans | 99.2 /100 | #90 | Exceptional 66.0% |
| Iranians | 99.2 /100 | #91 | Exceptional 66.0% |
| Aleuts | 99.1 /100 | #92 | Exceptional 66.0% |
| Immigrants | South America | 99.1 /100 | #93 | Exceptional 66.0% |
| Immigrants | Cambodia | 99.1 /100 | #94 | Exceptional 66.0% |
| Immigrants | Uruguay | 99.1 /100 | #95 | Exceptional 66.0% |
| Bangladeshis | 98.9 /100 | #96 | Exceptional 65.9% |
| Filipinos | 98.9 /100 | #97 | Exceptional 65.9% |
| Immigrants | Chile | 98.7 /100 | #98 | Exceptional 65.9% |
| Immigrants | Australia | 98.7 /100 | #99 | Exceptional 65.9% |
| Okinawans | 98.7 /100 | #100 | Exceptional 65.9% |
Demographics Similar to Chickasaw by In Labor Force | Age > 16
In terms of in labor force | age > 16, the demographic groups most similar to Chickasaw are Kiowa (62.4%, a difference of 0.19%), Arapaho (62.1%, a difference of 0.24%), Yakama (62.1%, a difference of 0.25%), American (62.1%, a difference of 0.28%), and Ottawa (62.0%, a difference of 0.44%).
| Demographics | Rating | Rank | In Labor Force | Age > 16 |
| Blackfeet | 0.0 /100 | #311 | Tragic 63.2% |
| Iroquois | 0.0 /100 | #312 | Tragic 63.2% |
| Chippewa | 0.0 /100 | #313 | Tragic 63.1% |
| Yaqui | 0.0 /100 | #314 | Tragic 63.0% |
| Potawatomi | 0.0 /100 | #315 | Tragic 62.8% |
| Yup'ik | 0.0 /100 | #316 | Tragic 62.7% |
| Kiowa | 0.0 /100 | #317 | Tragic 62.4% |
| Chickasaw | 0.0 /100 | #318 | Tragic 62.3% |
| Arapaho | 0.0 /100 | #319 | Tragic 62.1% |
| Yakama | 0.0 /100 | #320 | Tragic 62.1% |
| Americans | 0.0 /100 | #321 | Tragic 62.1% |
| Ottawa | 0.0 /100 | #322 | Tragic 62.0% |
| Seminole | 0.0 /100 | #323 | Tragic 62.0% |
| Cheyenne | 0.0 /100 | #324 | Tragic 62.0% |
| Cherokee | 0.0 /100 | #325 | Tragic 61.9% |