Spanish American vs Chickasaw In Labor Force | Age > 16
COMPARE
Spanish American
Chickasaw
In Labor Force | Age > 16
In Labor Force | Age > 16 Comparison
Spanish Americans
Chickasaw
63.6%
IN LABOR FORCE | AGE > 16
0.0/ 100
METRIC RATING
301st/ 347
METRIC RANK
62.3%
IN LABOR FORCE | AGE > 16
0.0/ 100
METRIC RATING
318th/ 347
METRIC RANK
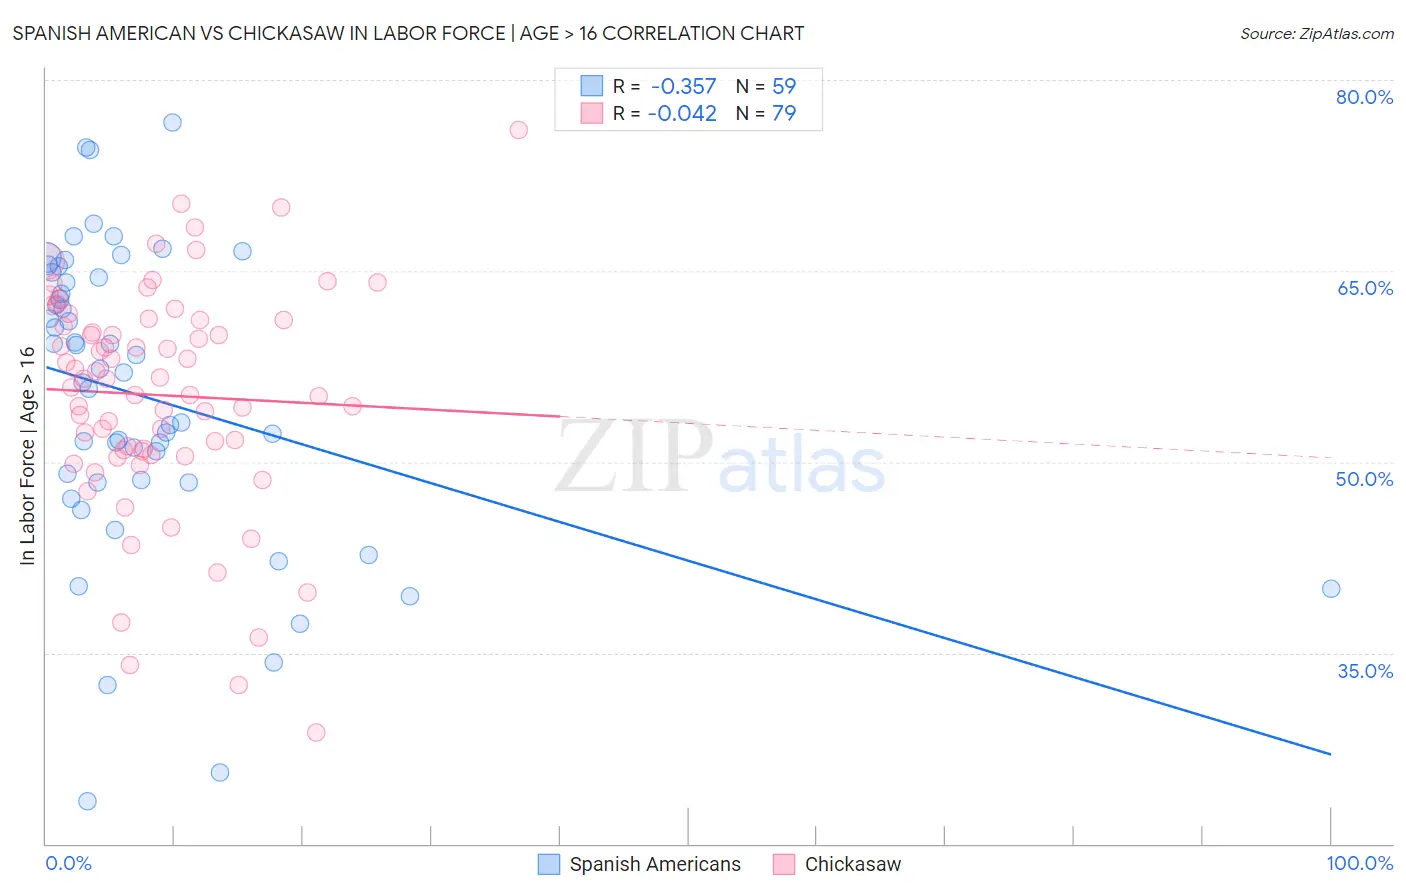
Spanish American vs Chickasaw In Labor Force | Age > 16 Correlation Chart
The statistical analysis conducted on geographies consisting of 103,168,383 people shows a mild negative correlation between the proportion of Spanish Americans and labor force participation rate among population ages 16 and over in the United States with a correlation coefficient (R) of -0.357 and weighted average of 63.6%. Similarly, the statistical analysis conducted on geographies consisting of 147,722,257 people shows no correlation between the proportion of Chickasaw and labor force participation rate among population ages 16 and over in the United States with a correlation coefficient (R) of -0.042 and weighted average of 62.3%, a difference of 2.1%.
In Labor Force | Age > 16 Correlation Summary
| Measurement | Spanish American | Chickasaw |
| Minimum | 23.3% | 28.7% |
| Maximum | 76.7% | 76.1% |
| Range | 53.4% | 47.4% |
| Mean | 55.1% | 55.2% |
| Median | 57.0% | 56.5% |
| Interquartile 25% (IQ1) | 48.4% | 50.9% |
| Interquartile 75% (IQ3) | 64.5% | 61.1% |
| Interquartile Range (IQR) | 16.1% | 10.2% |
| Standard Deviation (Sample) | 11.7% | 8.9% |
| Standard Deviation (Population) | 11.6% | 8.8% |
Demographics Similar to Spanish Americans and Chickasaw by In Labor Force | Age > 16
In terms of in labor force | age > 16, the demographic groups most similar to Spanish Americans are Delaware (63.6%, a difference of 0.010%), White/Caucasian (63.6%, a difference of 0.030%), Immigrants from the Azores (63.6%, a difference of 0.030%), Cree (63.5%, a difference of 0.050%), and Nonimmigrants (63.5%, a difference of 0.11%). Similarly, the demographic groups most similar to Chickasaw are Kiowa (62.4%, a difference of 0.19%), Arapaho (62.1%, a difference of 0.24%), Yup'ik (62.7%, a difference of 0.64%), Potawatomi (62.8%, a difference of 0.86%), and Yaqui (63.0%, a difference of 1.2%).
| Demographics | Rating | Rank | In Labor Force | Age > 16 |
| Whites/Caucasians | 0.0 /100 | #299 | Tragic 63.6% |
| Immigrants | Azores | 0.0 /100 | #300 | Tragic 63.6% |
| Spanish Americans | 0.0 /100 | #301 | Tragic 63.6% |
| Delaware | 0.0 /100 | #302 | Tragic 63.6% |
| Cree | 0.0 /100 | #303 | Tragic 63.5% |
| Immigrants | Nonimmigrants | 0.0 /100 | #304 | Tragic 63.5% |
| Osage | 0.0 /100 | #305 | Tragic 63.5% |
| Blacks/African Americans | 0.0 /100 | #306 | Tragic 63.4% |
| Central American Indians | 0.0 /100 | #307 | Tragic 63.4% |
| Pennsylvania Germans | 0.0 /100 | #308 | Tragic 63.4% |
| Scotch-Irish | 0.0 /100 | #309 | Tragic 63.3% |
| Shoshone | 0.0 /100 | #310 | Tragic 63.2% |
| Blackfeet | 0.0 /100 | #311 | Tragic 63.2% |
| Iroquois | 0.0 /100 | #312 | Tragic 63.2% |
| Chippewa | 0.0 /100 | #313 | Tragic 63.1% |
| Yaqui | 0.0 /100 | #314 | Tragic 63.0% |
| Potawatomi | 0.0 /100 | #315 | Tragic 62.8% |
| Yup'ik | 0.0 /100 | #316 | Tragic 62.7% |
| Kiowa | 0.0 /100 | #317 | Tragic 62.4% |
| Chickasaw | 0.0 /100 | #318 | Tragic 62.3% |
| Arapaho | 0.0 /100 | #319 | Tragic 62.1% |