Pueblo vs Chickasaw In Labor Force | Age > 16
COMPARE
Pueblo
Chickasaw
In Labor Force | Age > 16
In Labor Force | Age > 16 Comparison
Pueblo
Chickasaw
59.3%
IN LABOR FORCE | AGE > 16
0.0/ 100
METRIC RATING
340th/ 347
METRIC RANK
62.3%
IN LABOR FORCE | AGE > 16
0.0/ 100
METRIC RATING
318th/ 347
METRIC RANK
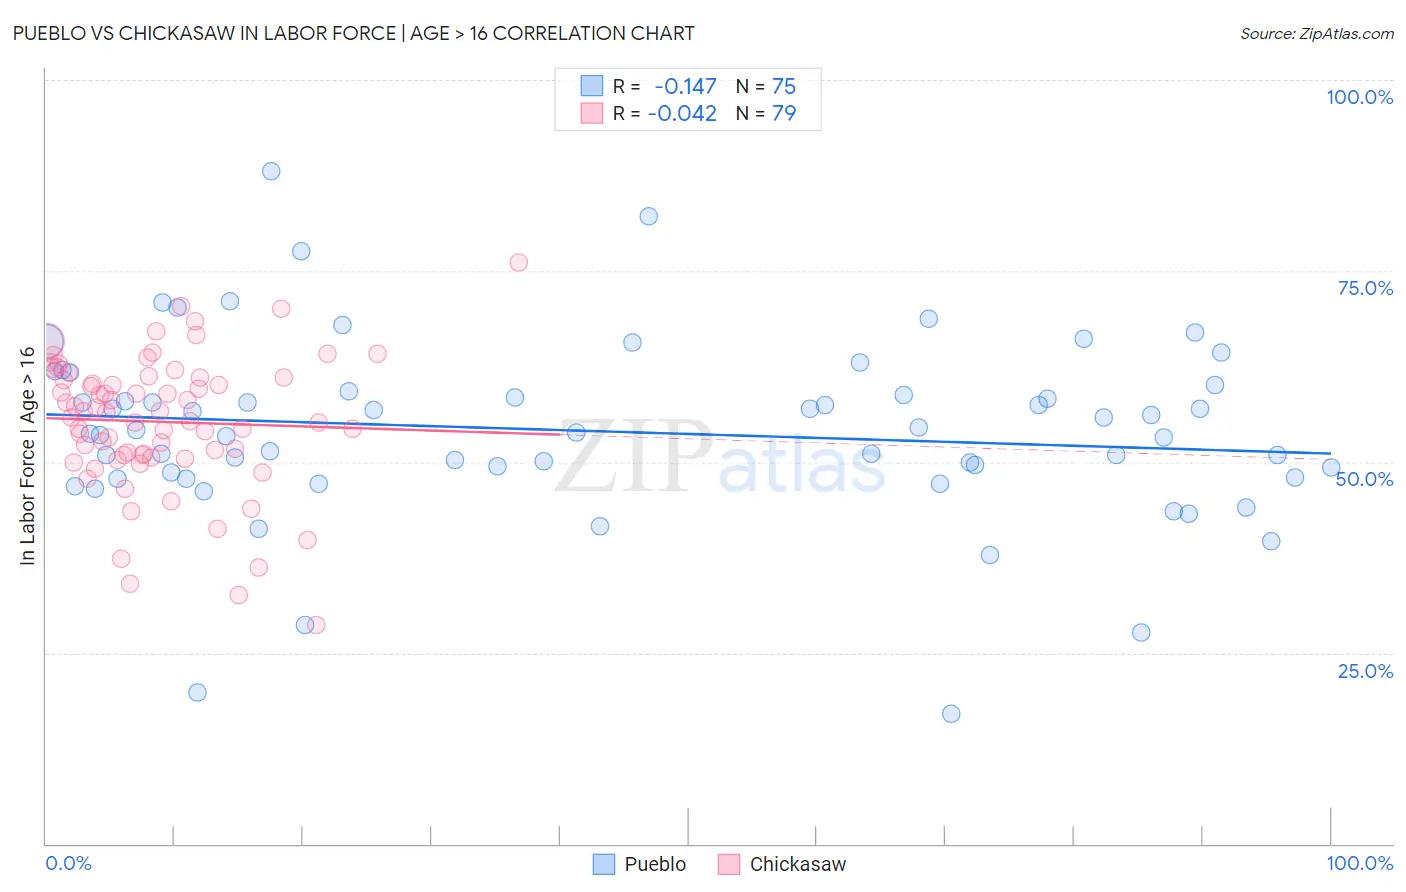
Pueblo vs Chickasaw In Labor Force | Age > 16 Correlation Chart
The statistical analysis conducted on geographies consisting of 120,084,171 people shows a poor negative correlation between the proportion of Pueblo and labor force participation rate among population ages 16 and over in the United States with a correlation coefficient (R) of -0.147 and weighted average of 59.3%. Similarly, the statistical analysis conducted on geographies consisting of 147,722,257 people shows no correlation between the proportion of Chickasaw and labor force participation rate among population ages 16 and over in the United States with a correlation coefficient (R) of -0.042 and weighted average of 62.3%, a difference of 5.1%.
In Labor Force | Age > 16 Correlation Summary
| Measurement | Pueblo | Chickasaw |
| Minimum | 17.1% | 28.7% |
| Maximum | 88.1% | 76.1% |
| Range | 71.0% | 47.4% |
| Mean | 54.0% | 55.2% |
| Median | 53.9% | 56.5% |
| Interquartile 25% (IQ1) | 48.0% | 50.9% |
| Interquartile 75% (IQ3) | 59.2% | 61.1% |
| Interquartile Range (IQR) | 11.2% | 10.2% |
| Standard Deviation (Sample) | 11.9% | 8.9% |
| Standard Deviation (Population) | 11.9% | 8.8% |
Similar Demographics by In Labor Force | Age > 16
Demographics Similar to Pueblo by In Labor Force | Age > 16
In terms of in labor force | age > 16, the demographic groups most similar to Pueblo are Houma (59.5%, a difference of 0.39%), Immigrants from Yemen (59.6%, a difference of 0.64%), Colville (59.8%, a difference of 0.92%), Hopi (58.4%, a difference of 1.5%), and Puerto Rican (58.1%, a difference of 2.0%).
| Demographics | Rating | Rank | In Labor Force | Age > 16 |
| Paiute | 0.0 /100 | #333 | Tragic 60.7% |
| Apache | 0.0 /100 | #334 | Tragic 60.7% |
| Natives/Alaskans | 0.0 /100 | #335 | Tragic 60.6% |
| Menominee | 0.0 /100 | #336 | Tragic 60.6% |
| Colville | 0.0 /100 | #337 | Tragic 59.8% |
| Immigrants | Yemen | 0.0 /100 | #338 | Tragic 59.6% |
| Houma | 0.0 /100 | #339 | Tragic 59.5% |
| Pueblo | 0.0 /100 | #340 | Tragic 59.3% |
| Hopi | 0.0 /100 | #341 | Tragic 58.4% |
| Puerto Ricans | 0.0 /100 | #342 | Tragic 58.1% |
| Yuman | 0.0 /100 | #343 | Tragic 57.8% |
| Pima | 0.0 /100 | #344 | Tragic 57.4% |
| Tohono O'odham | 0.0 /100 | #345 | Tragic 57.2% |
| Lumbee | 0.0 /100 | #346 | Tragic 56.8% |
| Navajo | 0.0 /100 | #347 | Tragic 56.6% |
Demographics Similar to Chickasaw by In Labor Force | Age > 16
In terms of in labor force | age > 16, the demographic groups most similar to Chickasaw are Kiowa (62.4%, a difference of 0.19%), Arapaho (62.1%, a difference of 0.24%), Yakama (62.1%, a difference of 0.25%), American (62.1%, a difference of 0.28%), and Ottawa (62.0%, a difference of 0.44%).
| Demographics | Rating | Rank | In Labor Force | Age > 16 |
| Blackfeet | 0.0 /100 | #311 | Tragic 63.2% |
| Iroquois | 0.0 /100 | #312 | Tragic 63.2% |
| Chippewa | 0.0 /100 | #313 | Tragic 63.1% |
| Yaqui | 0.0 /100 | #314 | Tragic 63.0% |
| Potawatomi | 0.0 /100 | #315 | Tragic 62.8% |
| Yup'ik | 0.0 /100 | #316 | Tragic 62.7% |
| Kiowa | 0.0 /100 | #317 | Tragic 62.4% |
| Chickasaw | 0.0 /100 | #318 | Tragic 62.3% |
| Arapaho | 0.0 /100 | #319 | Tragic 62.1% |
| Yakama | 0.0 /100 | #320 | Tragic 62.1% |
| Americans | 0.0 /100 | #321 | Tragic 62.1% |
| Ottawa | 0.0 /100 | #322 | Tragic 62.0% |
| Seminole | 0.0 /100 | #323 | Tragic 62.0% |
| Cheyenne | 0.0 /100 | #324 | Tragic 62.0% |
| Cherokee | 0.0 /100 | #325 | Tragic 61.9% |