Immigrants from South America vs Hawaiian In Labor Force | Age > 16
COMPARE
Immigrants from South America
Hawaiian
In Labor Force | Age > 16
In Labor Force | Age > 16 Comparison
Immigrants from South America
Hawaiians
66.0%
IN LABOR FORCE | AGE > 16
99.1/ 100
METRIC RATING
93rd/ 347
METRIC RANK
64.7%
IN LABOR FORCE | AGE > 16
9.3/ 100
METRIC RATING
222nd/ 347
METRIC RANK
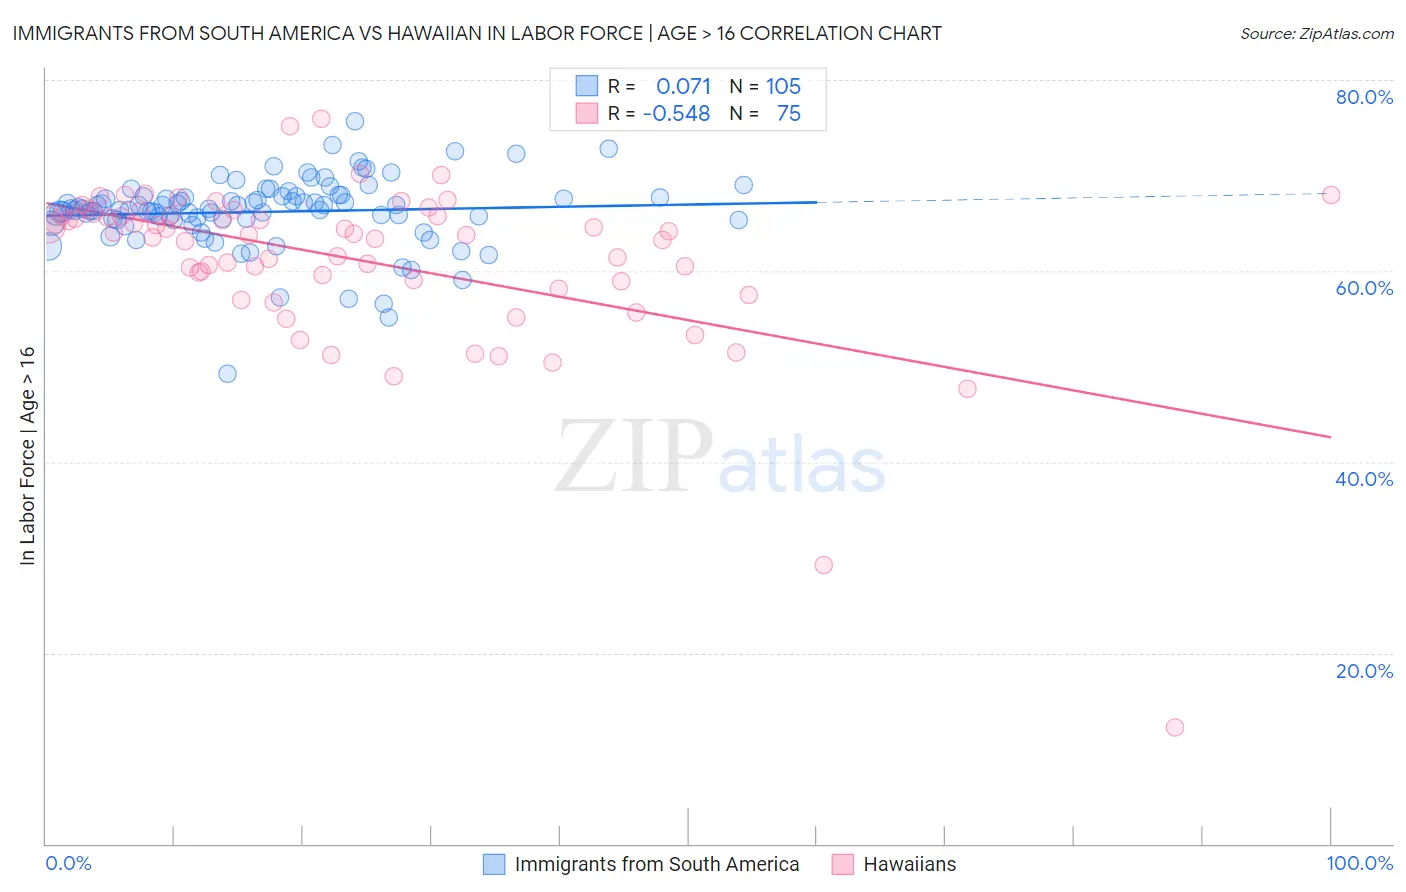
Immigrants from South America vs Hawaiian In Labor Force | Age > 16 Correlation Chart
The statistical analysis conducted on geographies consisting of 486,427,951 people shows a slight positive correlation between the proportion of Immigrants from South America and labor force participation rate among population ages 16 and over in the United States with a correlation coefficient (R) of 0.071 and weighted average of 66.0%. Similarly, the statistical analysis conducted on geographies consisting of 327,602,725 people shows a substantial negative correlation between the proportion of Hawaiians and labor force participation rate among population ages 16 and over in the United States with a correlation coefficient (R) of -0.548 and weighted average of 64.7%, a difference of 2.0%.
In Labor Force | Age > 16 Correlation Summary
| Measurement | Immigrants from South America | Hawaiian |
| Minimum | 49.2% | 12.2% |
| Maximum | 75.7% | 76.0% |
| Range | 26.5% | 63.8% |
| Mean | 66.2% | 61.2% |
| Median | 66.5% | 63.8% |
| Interquartile 25% (IQ1) | 65.4% | 59.0% |
| Interquartile 75% (IQ3) | 67.8% | 65.9% |
| Interquartile Range (IQR) | 2.4% | 6.9% |
| Standard Deviation (Sample) | 3.8% | 9.0% |
| Standard Deviation (Population) | 3.8% | 8.9% |
Similar Demographics by In Labor Force | Age > 16
Demographics Similar to Immigrants from South America by In Labor Force | Age > 16
In terms of in labor force | age > 16, the demographic groups most similar to Immigrants from South America are Aleut (66.0%, a difference of 0.010%), Immigrants from Cambodia (66.0%, a difference of 0.020%), Immigrants from Uruguay (66.0%, a difference of 0.020%), Immigrants from Laos (66.0%, a difference of 0.030%), and Chilean (66.0%, a difference of 0.030%).
| Demographics | Rating | Rank | In Labor Force | Age > 16 |
| South Americans | 99.4 /100 | #86 | Exceptional 66.0% |
| South American Indians | 99.4 /100 | #87 | Exceptional 66.0% |
| Bermudans | 99.3 /100 | #88 | Exceptional 66.0% |
| Immigrants | Laos | 99.2 /100 | #89 | Exceptional 66.0% |
| Chileans | 99.2 /100 | #90 | Exceptional 66.0% |
| Iranians | 99.2 /100 | #91 | Exceptional 66.0% |
| Aleuts | 99.1 /100 | #92 | Exceptional 66.0% |
| Immigrants | South America | 99.1 /100 | #93 | Exceptional 66.0% |
| Immigrants | Cambodia | 99.1 /100 | #94 | Exceptional 66.0% |
| Immigrants | Uruguay | 99.1 /100 | #95 | Exceptional 66.0% |
| Bangladeshis | 98.9 /100 | #96 | Exceptional 65.9% |
| Filipinos | 98.9 /100 | #97 | Exceptional 65.9% |
| Immigrants | Chile | 98.7 /100 | #98 | Exceptional 65.9% |
| Immigrants | Australia | 98.7 /100 | #99 | Exceptional 65.9% |
| Okinawans | 98.7 /100 | #100 | Exceptional 65.9% |
Demographics Similar to Hawaiians by In Labor Force | Age > 16
In terms of in labor force | age > 16, the demographic groups most similar to Hawaiians are Immigrants from Belize (64.7%, a difference of 0.0%), Immigrants from Micronesia (64.7%, a difference of 0.010%), Alaska Native (64.7%, a difference of 0.020%), Immigrants from Jamaica (64.7%, a difference of 0.020%), and Croatian (64.7%, a difference of 0.020%).
| Demographics | Rating | Rank | In Labor Force | Age > 16 |
| Immigrants | Czechoslovakia | 12.3 /100 | #215 | Poor 64.8% |
| Belgians | 11.4 /100 | #216 | Poor 64.7% |
| U.S. Virgin Islanders | 11.3 /100 | #217 | Poor 64.7% |
| Alsatians | 10.7 /100 | #218 | Poor 64.7% |
| Immigrants | Central America | 10.5 /100 | #219 | Poor 64.7% |
| Alaska Natives | 9.9 /100 | #220 | Tragic 64.7% |
| Immigrants | Micronesia | 9.6 /100 | #221 | Tragic 64.7% |
| Hawaiians | 9.3 /100 | #222 | Tragic 64.7% |
| Immigrants | Belize | 9.2 /100 | #223 | Tragic 64.7% |
| Immigrants | Jamaica | 8.8 /100 | #224 | Tragic 64.7% |
| Croatians | 8.8 /100 | #225 | Tragic 64.7% |
| Europeans | 8.3 /100 | #226 | Tragic 64.7% |
| Poles | 8.3 /100 | #227 | Tragic 64.7% |
| Northern Europeans | 8.2 /100 | #228 | Tragic 64.7% |
| British | 7.3 /100 | #229 | Tragic 64.7% |