Immigrants from South America vs Argentinean In Labor Force | Age > 16
COMPARE
Immigrants from South America
Argentinean
In Labor Force | Age > 16
In Labor Force | Age > 16 Comparison
Immigrants from South America
Argentineans
66.0%
IN LABOR FORCE | AGE > 16
99.1/ 100
METRIC RATING
93rd/ 347
METRIC RANK
65.7%
IN LABOR FORCE | AGE > 16
96.7/ 100
METRIC RATING
116th/ 347
METRIC RANK
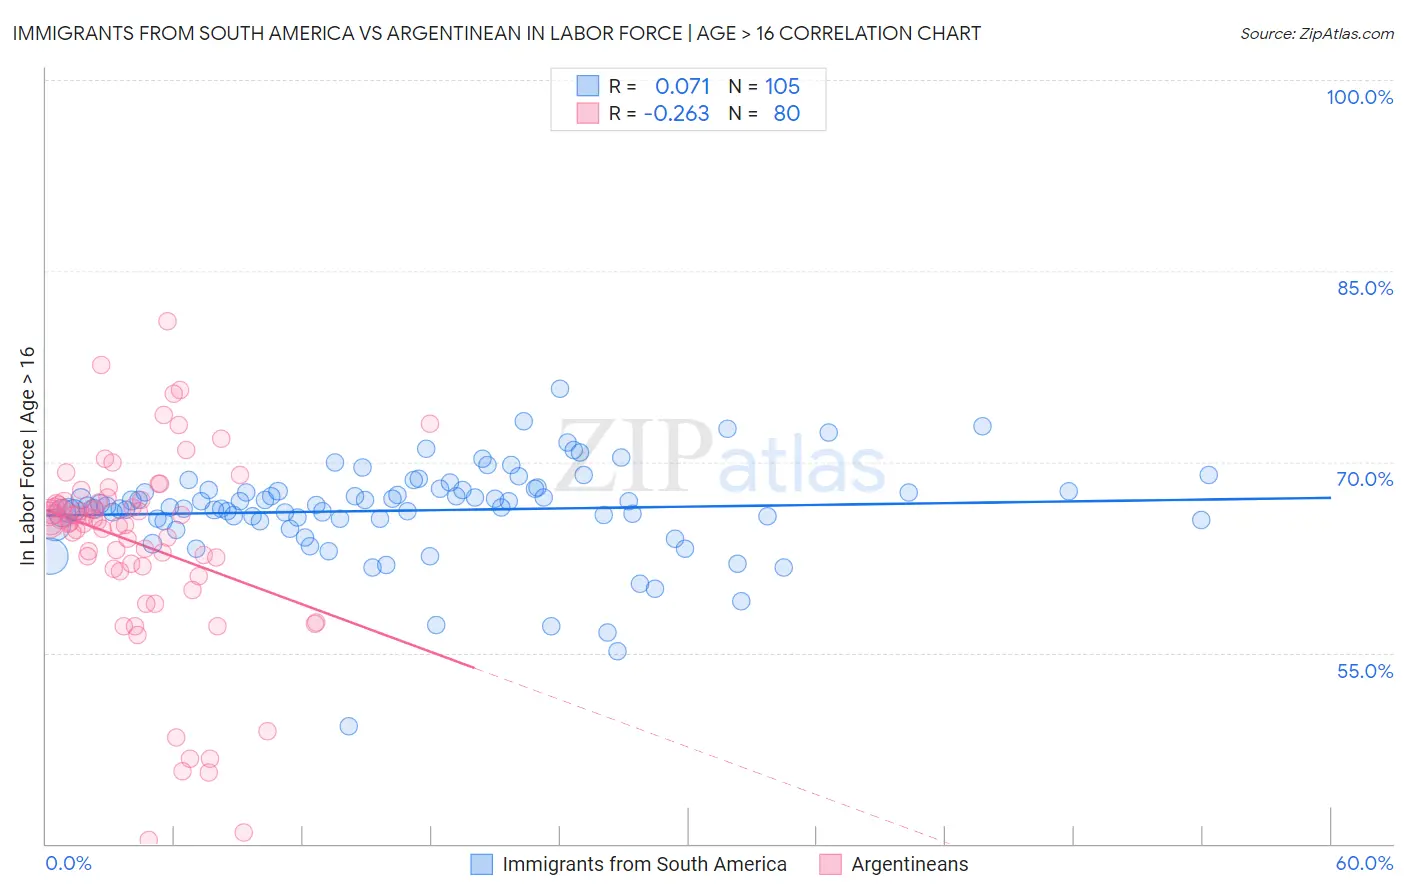
Immigrants from South America vs Argentinean In Labor Force | Age > 16 Correlation Chart
The statistical analysis conducted on geographies consisting of 486,427,951 people shows a slight positive correlation between the proportion of Immigrants from South America and labor force participation rate among population ages 16 and over in the United States with a correlation coefficient (R) of 0.071 and weighted average of 66.0%. Similarly, the statistical analysis conducted on geographies consisting of 297,149,782 people shows a weak negative correlation between the proportion of Argentineans and labor force participation rate among population ages 16 and over in the United States with a correlation coefficient (R) of -0.263 and weighted average of 65.7%, a difference of 0.38%.
In Labor Force | Age > 16 Correlation Summary
| Measurement | Immigrants from South America | Argentinean |
| Minimum | 49.2% | 40.3% |
| Maximum | 75.7% | 81.0% |
| Range | 26.5% | 40.7% |
| Mean | 66.2% | 63.6% |
| Median | 66.5% | 65.3% |
| Interquartile 25% (IQ1) | 65.4% | 61.7% |
| Interquartile 75% (IQ3) | 67.8% | 66.9% |
| Interquartile Range (IQR) | 2.4% | 5.2% |
| Standard Deviation (Sample) | 3.8% | 7.7% |
| Standard Deviation (Population) | 3.8% | 7.6% |
Similar Demographics by In Labor Force | Age > 16
Demographics Similar to Immigrants from South America by In Labor Force | Age > 16
In terms of in labor force | age > 16, the demographic groups most similar to Immigrants from South America are Aleut (66.0%, a difference of 0.010%), Immigrants from Cambodia (66.0%, a difference of 0.020%), Immigrants from Uruguay (66.0%, a difference of 0.020%), Immigrants from Laos (66.0%, a difference of 0.030%), and Chilean (66.0%, a difference of 0.030%).
| Demographics | Rating | Rank | In Labor Force | Age > 16 |
| South Americans | 99.4 /100 | #86 | Exceptional 66.0% |
| South American Indians | 99.4 /100 | #87 | Exceptional 66.0% |
| Bermudans | 99.3 /100 | #88 | Exceptional 66.0% |
| Immigrants | Laos | 99.2 /100 | #89 | Exceptional 66.0% |
| Chileans | 99.2 /100 | #90 | Exceptional 66.0% |
| Iranians | 99.2 /100 | #91 | Exceptional 66.0% |
| Aleuts | 99.1 /100 | #92 | Exceptional 66.0% |
| Immigrants | South America | 99.1 /100 | #93 | Exceptional 66.0% |
| Immigrants | Cambodia | 99.1 /100 | #94 | Exceptional 66.0% |
| Immigrants | Uruguay | 99.1 /100 | #95 | Exceptional 66.0% |
| Bangladeshis | 98.9 /100 | #96 | Exceptional 65.9% |
| Filipinos | 98.9 /100 | #97 | Exceptional 65.9% |
| Immigrants | Chile | 98.7 /100 | #98 | Exceptional 65.9% |
| Immigrants | Australia | 98.7 /100 | #99 | Exceptional 65.9% |
| Okinawans | 98.7 /100 | #100 | Exceptional 65.9% |
Demographics Similar to Argentineans by In Labor Force | Age > 16
In terms of in labor force | age > 16, the demographic groups most similar to Argentineans are Immigrants from Indonesia (65.7%, a difference of 0.010%), Immigrants from Iran (65.7%, a difference of 0.010%), Immigrants from Thailand (65.7%, a difference of 0.010%), Immigrants from France (65.7%, a difference of 0.020%), and Pakistani (65.8%, a difference of 0.040%).
| Demographics | Rating | Rank | In Labor Force | Age > 16 |
| Immigrants | Japan | 98.0 /100 | #109 | Exceptional 65.8% |
| Japanese | 97.7 /100 | #110 | Exceptional 65.8% |
| Immigrants | Honduras | 97.5 /100 | #111 | Exceptional 65.8% |
| Laotians | 97.4 /100 | #112 | Exceptional 65.8% |
| Pakistanis | 97.1 /100 | #113 | Exceptional 65.8% |
| Hondurans | 97.1 /100 | #114 | Exceptional 65.8% |
| Immigrants | Indonesia | 96.8 /100 | #115 | Exceptional 65.7% |
| Argentineans | 96.7 /100 | #116 | Exceptional 65.7% |
| Immigrants | Iran | 96.6 /100 | #117 | Exceptional 65.7% |
| Immigrants | Thailand | 96.6 /100 | #118 | Exceptional 65.7% |
| Immigrants | France | 96.4 /100 | #119 | Exceptional 65.7% |
| Immigrants | Hong Kong | 96.2 /100 | #120 | Exceptional 65.7% |
| New Zealanders | 96.0 /100 | #121 | Exceptional 65.7% |
| Immigrants | Ecuador | 95.9 /100 | #122 | Exceptional 65.7% |
| Immigrants | Iraq | 95.5 /100 | #123 | Exceptional 65.7% |