Immigrants from Scotland vs Celtic In Labor Force | Age 20-64
COMPARE
Immigrants from Scotland
Celtic
In Labor Force | Age 20-64
In Labor Force | Age 20-64 Comparison
Immigrants from Scotland
Celtics
79.6%
IN LABOR FORCE | AGE 20-64
52.4/ 100
METRIC RATING
173rd/ 347
METRIC RANK
78.7%
IN LABOR FORCE | AGE 20-64
0.5/ 100
METRIC RATING
256th/ 347
METRIC RANK
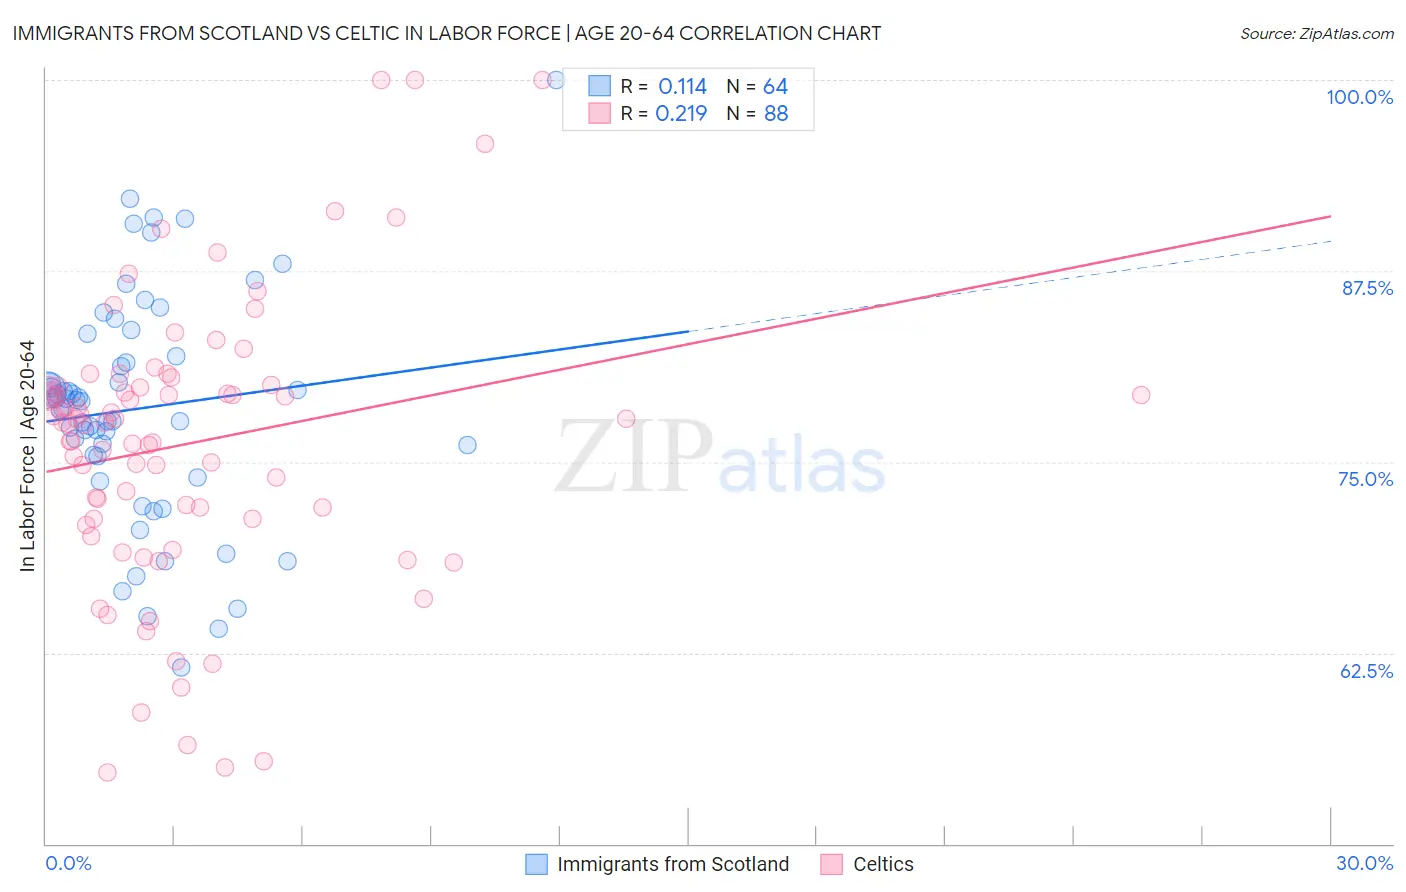
Immigrants from Scotland vs Celtic In Labor Force | Age 20-64 Correlation Chart
The statistical analysis conducted on geographies consisting of 196,399,264 people shows a poor positive correlation between the proportion of Immigrants from Scotland and labor force participation rate among population between the ages 20 and 64 in the United States with a correlation coefficient (R) of 0.114 and weighted average of 79.6%. Similarly, the statistical analysis conducted on geographies consisting of 168,869,465 people shows a weak positive correlation between the proportion of Celtics and labor force participation rate among population between the ages 20 and 64 in the United States with a correlation coefficient (R) of 0.219 and weighted average of 78.7%, a difference of 1.1%.
In Labor Force | Age 20-64 Correlation Summary
| Measurement | Immigrants from Scotland | Celtic |
| Minimum | 61.5% | 54.7% |
| Maximum | 100.0% | 100.0% |
| Range | 38.5% | 45.3% |
| Mean | 78.5% | 76.2% |
| Median | 79.0% | 77.6% |
| Interquartile 25% (IQ1) | 75.4% | 71.3% |
| Interquartile 75% (IQ3) | 81.7% | 79.9% |
| Interquartile Range (IQR) | 6.3% | 8.6% |
| Standard Deviation (Sample) | 7.4% | 9.3% |
| Standard Deviation (Population) | 7.3% | 9.3% |
Similar Demographics by In Labor Force | Age 20-64
Demographics Similar to Immigrants from Scotland by In Labor Force | Age 20-64
In terms of in labor force | age 20-64, the demographic groups most similar to Immigrants from Scotland are Slavic (79.6%, a difference of 0.010%), Immigrants from Switzerland (79.6%, a difference of 0.010%), Immigrants from Belgium (79.6%, a difference of 0.010%), Syrian (79.6%, a difference of 0.020%), and Laotian (79.6%, a difference of 0.050%).
| Demographics | Rating | Rank | In Labor Force | Age 20-64 |
| Okinawans | 62.7 /100 | #166 | Good 79.6% |
| Immigrants | Iraq | 62.0 /100 | #167 | Good 79.6% |
| Immigrants | Indonesia | 61.8 /100 | #168 | Good 79.6% |
| Laotians | 58.4 /100 | #169 | Average 79.6% |
| Slavs | 54.0 /100 | #170 | Average 79.6% |
| Immigrants | Switzerland | 53.3 /100 | #171 | Average 79.6% |
| Immigrants | Belgium | 53.1 /100 | #172 | Average 79.6% |
| Immigrants | Scotland | 52.4 /100 | #173 | Average 79.6% |
| Syrians | 50.0 /100 | #174 | Average 79.6% |
| Cubans | 46.1 /100 | #175 | Average 79.5% |
| Australians | 46.0 /100 | #176 | Average 79.5% |
| Immigrants | Netherlands | 45.2 /100 | #177 | Average 79.5% |
| Czechoslovakians | 44.3 /100 | #178 | Average 79.5% |
| Armenians | 41.4 /100 | #179 | Average 79.5% |
| Salvadorans | 41.0 /100 | #180 | Average 79.5% |
Demographics Similar to Celtics by In Labor Force | Age 20-64
In terms of in labor force | age 20-64, the demographic groups most similar to Celtics are Hawaiian (78.7%, a difference of 0.0%), Basque (78.7%, a difference of 0.020%), Immigrants from Lebanon (78.7%, a difference of 0.020%), Guatemalan (78.7%, a difference of 0.020%), and Immigrants from Guatemala (78.7%, a difference of 0.020%).
| Demographics | Rating | Rank | In Labor Force | Age 20-64 |
| English | 0.9 /100 | #249 | Tragic 78.8% |
| Hondurans | 0.8 /100 | #250 | Tragic 78.8% |
| Barbadians | 0.7 /100 | #251 | Tragic 78.8% |
| Immigrants | Honduras | 0.6 /100 | #252 | Tragic 78.7% |
| Basques | 0.5 /100 | #253 | Tragic 78.7% |
| Immigrants | Lebanon | 0.5 /100 | #254 | Tragic 78.7% |
| Hawaiians | 0.5 /100 | #255 | Tragic 78.7% |
| Celtics | 0.5 /100 | #256 | Tragic 78.7% |
| Guatemalans | 0.4 /100 | #257 | Tragic 78.7% |
| Immigrants | Guatemala | 0.4 /100 | #258 | Tragic 78.7% |
| Tsimshian | 0.4 /100 | #259 | Tragic 78.7% |
| Immigrants | Fiji | 0.3 /100 | #260 | Tragic 78.6% |
| Whites/Caucasians | 0.2 /100 | #261 | Tragic 78.5% |
| Fijians | 0.1 /100 | #262 | Tragic 78.4% |
| Pennsylvania Germans | 0.1 /100 | #263 | Tragic 78.4% |