Immigrants from Scotland vs Lebanese In Labor Force | Age 20-64
COMPARE
Immigrants from Scotland
Lebanese
In Labor Force | Age 20-64
In Labor Force | Age 20-64 Comparison
Immigrants from Scotland
Lebanese
79.6%
IN LABOR FORCE | AGE 20-64
52.4/ 100
METRIC RATING
173rd/ 347
METRIC RANK
79.1%
IN LABOR FORCE | AGE 20-64
5.1/ 100
METRIC RATING
231st/ 347
METRIC RANK
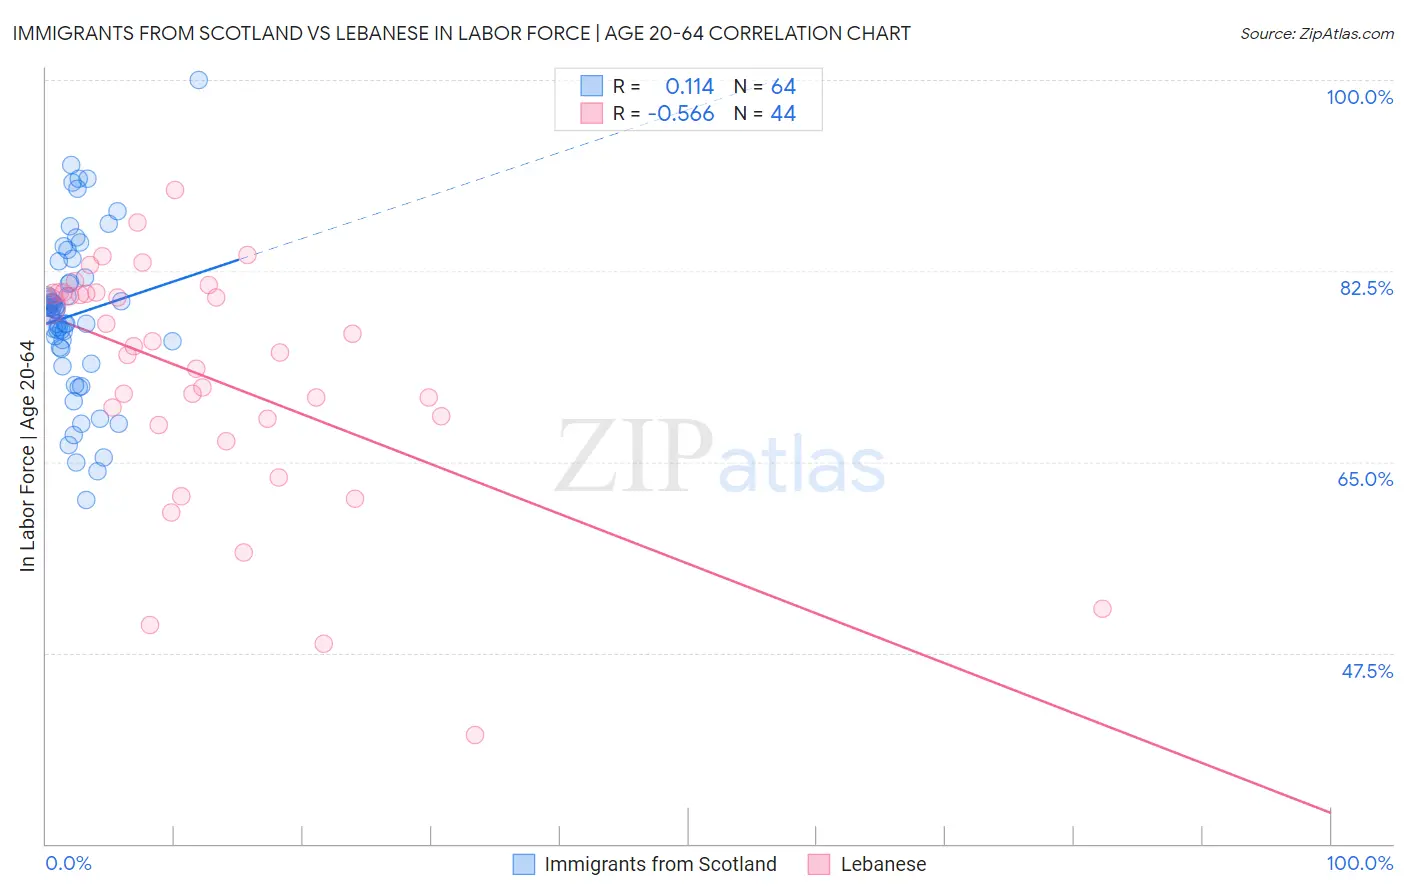
Immigrants from Scotland vs Lebanese In Labor Force | Age 20-64 Correlation Chart
The statistical analysis conducted on geographies consisting of 196,399,264 people shows a poor positive correlation between the proportion of Immigrants from Scotland and labor force participation rate among population between the ages 20 and 64 in the United States with a correlation coefficient (R) of 0.114 and weighted average of 79.6%. Similarly, the statistical analysis conducted on geographies consisting of 401,626,649 people shows a substantial negative correlation between the proportion of Lebanese and labor force participation rate among population between the ages 20 and 64 in the United States with a correlation coefficient (R) of -0.566 and weighted average of 79.1%, a difference of 0.61%.
In Labor Force | Age 20-64 Correlation Summary
| Measurement | Immigrants from Scotland | Lebanese |
| Minimum | 61.5% | 40.0% |
| Maximum | 100.0% | 89.9% |
| Range | 38.5% | 49.9% |
| Mean | 78.5% | 72.7% |
| Median | 79.0% | 75.3% |
| Interquartile 25% (IQ1) | 75.4% | 68.6% |
| Interquartile 75% (IQ3) | 81.7% | 80.5% |
| Interquartile Range (IQR) | 6.3% | 11.9% |
| Standard Deviation (Sample) | 7.4% | 11.0% |
| Standard Deviation (Population) | 7.3% | 10.9% |
Similar Demographics by In Labor Force | Age 20-64
Demographics Similar to Immigrants from Scotland by In Labor Force | Age 20-64
In terms of in labor force | age 20-64, the demographic groups most similar to Immigrants from Scotland are Slavic (79.6%, a difference of 0.010%), Immigrants from Switzerland (79.6%, a difference of 0.010%), Immigrants from Belgium (79.6%, a difference of 0.010%), Syrian (79.6%, a difference of 0.020%), and Laotian (79.6%, a difference of 0.050%).
| Demographics | Rating | Rank | In Labor Force | Age 20-64 |
| Okinawans | 62.7 /100 | #166 | Good 79.6% |
| Immigrants | Iraq | 62.0 /100 | #167 | Good 79.6% |
| Immigrants | Indonesia | 61.8 /100 | #168 | Good 79.6% |
| Laotians | 58.4 /100 | #169 | Average 79.6% |
| Slavs | 54.0 /100 | #170 | Average 79.6% |
| Immigrants | Switzerland | 53.3 /100 | #171 | Average 79.6% |
| Immigrants | Belgium | 53.1 /100 | #172 | Average 79.6% |
| Immigrants | Scotland | 52.4 /100 | #173 | Average 79.6% |
| Syrians | 50.0 /100 | #174 | Average 79.6% |
| Cubans | 46.1 /100 | #175 | Average 79.5% |
| Australians | 46.0 /100 | #176 | Average 79.5% |
| Immigrants | Netherlands | 45.2 /100 | #177 | Average 79.5% |
| Czechoslovakians | 44.3 /100 | #178 | Average 79.5% |
| Armenians | 41.4 /100 | #179 | Average 79.5% |
| Salvadorans | 41.0 /100 | #180 | Average 79.5% |
Demographics Similar to Lebanese by In Labor Force | Age 20-64
In terms of in labor force | age 20-64, the demographic groups most similar to Lebanese are Panamanian (79.1%, a difference of 0.020%), Alsatian (79.1%, a difference of 0.020%), Native Hawaiian (79.1%, a difference of 0.020%), Guamanian/Chamorro (79.1%, a difference of 0.020%), and Central American (79.1%, a difference of 0.030%).
| Demographics | Rating | Rank | In Labor Force | Age 20-64 |
| Immigrants | Uzbekistan | 6.8 /100 | #224 | Tragic 79.1% |
| Portuguese | 6.4 /100 | #225 | Tragic 79.1% |
| Central Americans | 5.9 /100 | #226 | Tragic 79.1% |
| Immigrants | Western Europe | 5.9 /100 | #227 | Tragic 79.1% |
| Panamanians | 5.7 /100 | #228 | Tragic 79.1% |
| Alsatians | 5.7 /100 | #229 | Tragic 79.1% |
| Native Hawaiians | 5.6 /100 | #230 | Tragic 79.1% |
| Lebanese | 5.1 /100 | #231 | Tragic 79.1% |
| Guamanians/Chamorros | 4.5 /100 | #232 | Tragic 79.1% |
| Japanese | 4.0 /100 | #233 | Tragic 79.1% |
| Immigrants | Canada | 3.2 /100 | #234 | Tragic 79.0% |
| Tlingit-Haida | 3.2 /100 | #235 | Tragic 79.0% |
| Samoans | 2.9 /100 | #236 | Tragic 79.0% |
| Immigrants | North America | 2.9 /100 | #237 | Tragic 79.0% |
| Immigrants | Jamaica | 2.6 /100 | #238 | Tragic 79.0% |