Immigrants from Scotland vs Luxembourger In Labor Force | Age 20-64
COMPARE
Immigrants from Scotland
Luxembourger
In Labor Force | Age 20-64
In Labor Force | Age 20-64 Comparison
Immigrants from Scotland
Luxembourgers
79.6%
IN LABOR FORCE | AGE 20-64
52.4/ 100
METRIC RATING
173rd/ 347
METRIC RANK
81.9%
IN LABOR FORCE | AGE 20-64
100.0/ 100
METRIC RATING
4th/ 347
METRIC RANK
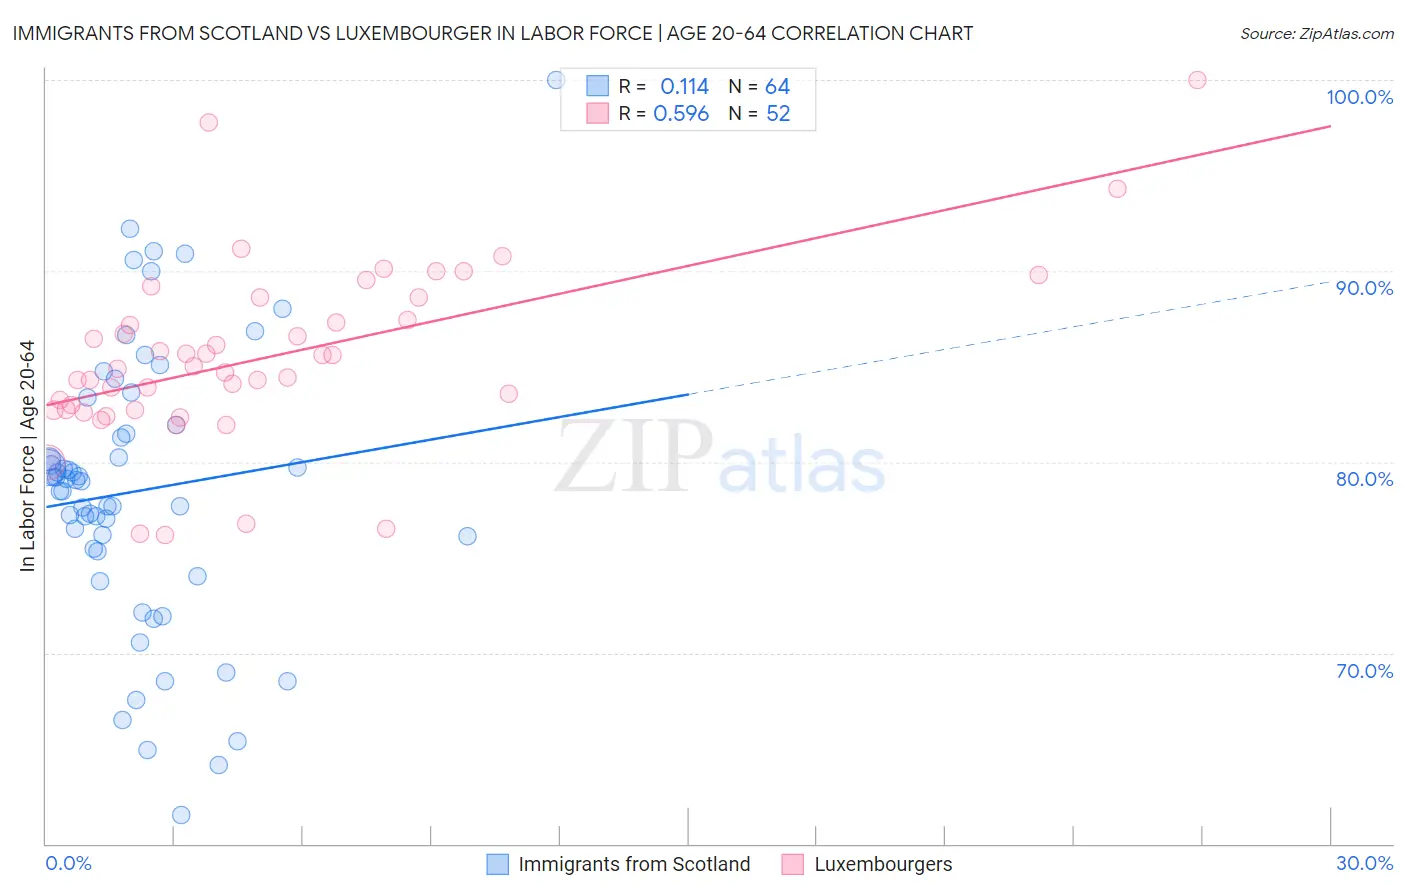
Immigrants from Scotland vs Luxembourger In Labor Force | Age 20-64 Correlation Chart
The statistical analysis conducted on geographies consisting of 196,399,264 people shows a poor positive correlation between the proportion of Immigrants from Scotland and labor force participation rate among population between the ages 20 and 64 in the United States with a correlation coefficient (R) of 0.114 and weighted average of 79.6%. Similarly, the statistical analysis conducted on geographies consisting of 144,682,920 people shows a substantial positive correlation between the proportion of Luxembourgers and labor force participation rate among population between the ages 20 and 64 in the United States with a correlation coefficient (R) of 0.596 and weighted average of 81.9%, a difference of 2.9%.
In Labor Force | Age 20-64 Correlation Summary
| Measurement | Immigrants from Scotland | Luxembourger |
| Minimum | 61.5% | 76.2% |
| Maximum | 100.0% | 100.0% |
| Range | 38.5% | 23.8% |
| Mean | 78.5% | 85.5% |
| Median | 79.0% | 84.9% |
| Interquartile 25% (IQ1) | 75.4% | 82.7% |
| Interquartile 75% (IQ3) | 81.7% | 88.0% |
| Interquartile Range (IQR) | 6.3% | 5.3% |
| Standard Deviation (Sample) | 7.4% | 4.7% |
| Standard Deviation (Population) | 7.3% | 4.6% |
Similar Demographics by In Labor Force | Age 20-64
Demographics Similar to Immigrants from Scotland by In Labor Force | Age 20-64
In terms of in labor force | age 20-64, the demographic groups most similar to Immigrants from Scotland are Slavic (79.6%, a difference of 0.010%), Immigrants from Switzerland (79.6%, a difference of 0.010%), Immigrants from Belgium (79.6%, a difference of 0.010%), Syrian (79.6%, a difference of 0.020%), and Laotian (79.6%, a difference of 0.050%).
| Demographics | Rating | Rank | In Labor Force | Age 20-64 |
| Okinawans | 62.7 /100 | #166 | Good 79.6% |
| Immigrants | Iraq | 62.0 /100 | #167 | Good 79.6% |
| Immigrants | Indonesia | 61.8 /100 | #168 | Good 79.6% |
| Laotians | 58.4 /100 | #169 | Average 79.6% |
| Slavs | 54.0 /100 | #170 | Average 79.6% |
| Immigrants | Switzerland | 53.3 /100 | #171 | Average 79.6% |
| Immigrants | Belgium | 53.1 /100 | #172 | Average 79.6% |
| Immigrants | Scotland | 52.4 /100 | #173 | Average 79.6% |
| Syrians | 50.0 /100 | #174 | Average 79.6% |
| Cubans | 46.1 /100 | #175 | Average 79.5% |
| Australians | 46.0 /100 | #176 | Average 79.5% |
| Immigrants | Netherlands | 45.2 /100 | #177 | Average 79.5% |
| Czechoslovakians | 44.3 /100 | #178 | Average 79.5% |
| Armenians | 41.4 /100 | #179 | Average 79.5% |
| Salvadorans | 41.0 /100 | #180 | Average 79.5% |
Demographics Similar to Luxembourgers by In Labor Force | Age 20-64
In terms of in labor force | age 20-64, the demographic groups most similar to Luxembourgers are Immigrants from Bolivia (81.9%, a difference of 0.12%), Ethiopian (82.0%, a difference of 0.13%), Bolivian (81.7%, a difference of 0.20%), Immigrants from Ethiopia (82.1%, a difference of 0.25%), and Somali (81.6%, a difference of 0.31%).
| Demographics | Rating | Rank | In Labor Force | Age 20-64 |
| Immigrants | Ethiopia | 100.0 /100 | #1 | Exceptional 82.1% |
| Ethiopians | 100.0 /100 | #2 | Exceptional 82.0% |
| Immigrants | Bolivia | 100.0 /100 | #3 | Exceptional 81.9% |
| Luxembourgers | 100.0 /100 | #4 | Exceptional 81.9% |
| Bolivians | 100.0 /100 | #5 | Exceptional 81.7% |
| Somalis | 100.0 /100 | #6 | Exceptional 81.6% |
| Immigrants | Cameroon | 100.0 /100 | #7 | Exceptional 81.6% |
| Immigrants | Somalia | 100.0 /100 | #8 | Exceptional 81.6% |
| Sierra Leoneans | 100.0 /100 | #9 | Exceptional 81.5% |
| Immigrants | Sierra Leone | 100.0 /100 | #10 | Exceptional 81.5% |
| Immigrants | Eastern Africa | 100.0 /100 | #11 | Exceptional 81.3% |
| Immigrants | Eritrea | 100.0 /100 | #12 | Exceptional 81.3% |
| Immigrants | India | 100.0 /100 | #13 | Exceptional 81.3% |
| Cambodians | 100.0 /100 | #14 | Exceptional 81.1% |
| Bulgarians | 100.0 /100 | #15 | Exceptional 81.1% |