German vs Celtic In Labor Force | Age 20-64
COMPARE
German
Celtic
In Labor Force | Age 20-64
In Labor Force | Age 20-64 Comparison
Germans
Celtics
79.7%
IN LABOR FORCE | AGE 20-64
65.2/ 100
METRIC RATING
162nd/ 347
METRIC RANK
78.7%
IN LABOR FORCE | AGE 20-64
0.5/ 100
METRIC RATING
256th/ 347
METRIC RANK
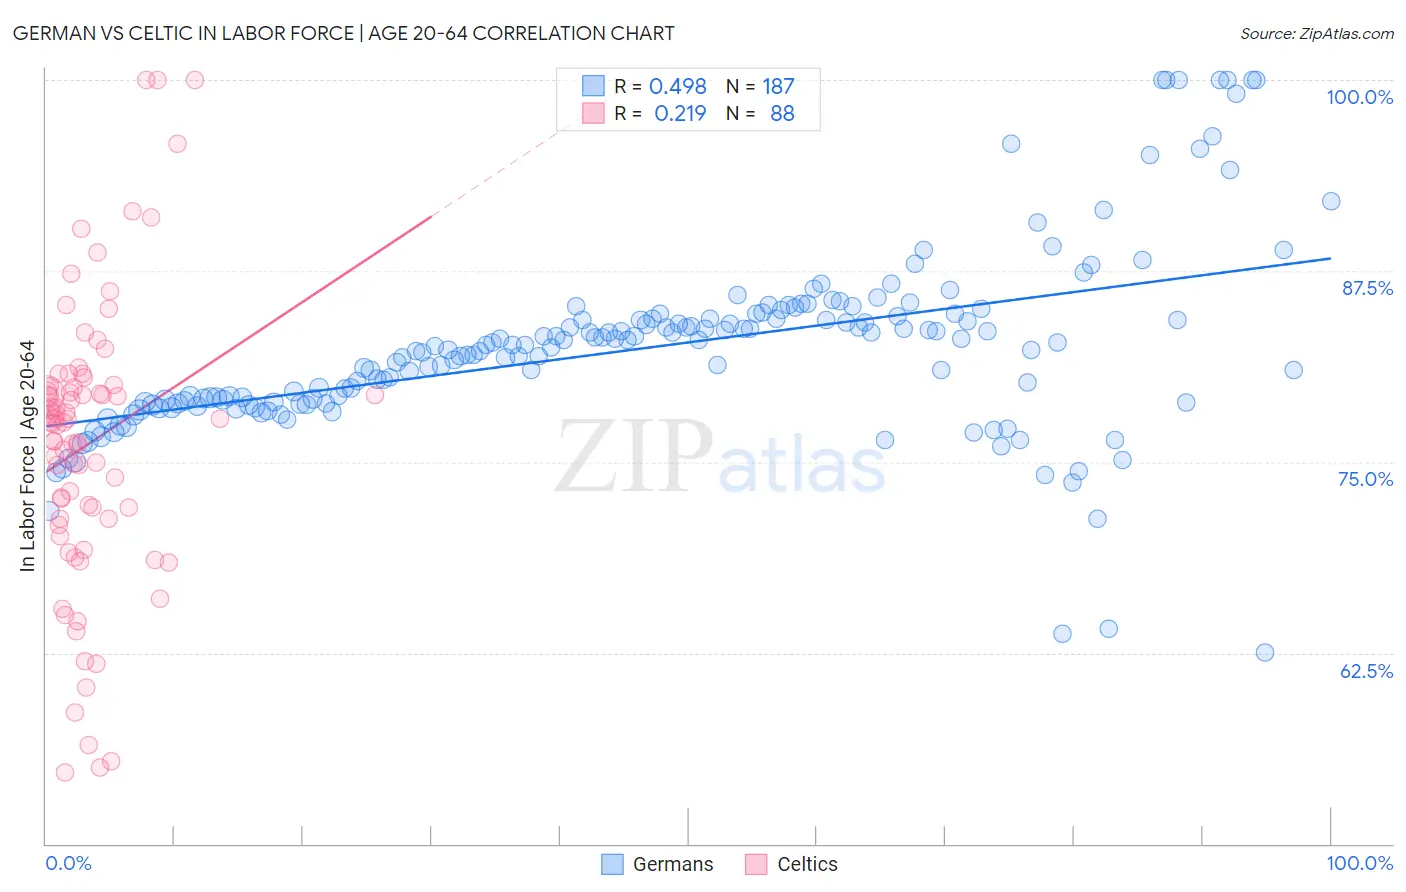
German vs Celtic In Labor Force | Age 20-64 Correlation Chart
The statistical analysis conducted on geographies consisting of 581,278,345 people shows a moderate positive correlation between the proportion of Germans and labor force participation rate among population between the ages 20 and 64 in the United States with a correlation coefficient (R) of 0.498 and weighted average of 79.7%. Similarly, the statistical analysis conducted on geographies consisting of 168,869,465 people shows a weak positive correlation between the proportion of Celtics and labor force participation rate among population between the ages 20 and 64 in the United States with a correlation coefficient (R) of 0.219 and weighted average of 78.7%, a difference of 1.2%.
In Labor Force | Age 20-64 Correlation Summary
| Measurement | German | Celtic |
| Minimum | 62.5% | 54.7% |
| Maximum | 100.0% | 100.0% |
| Range | 37.5% | 45.3% |
| Mean | 82.5% | 76.2% |
| Median | 82.6% | 77.6% |
| Interquartile 25% (IQ1) | 78.9% | 71.3% |
| Interquartile 75% (IQ3) | 84.4% | 79.9% |
| Interquartile Range (IQR) | 5.5% | 8.6% |
| Standard Deviation (Sample) | 6.1% | 9.3% |
| Standard Deviation (Population) | 6.1% | 9.3% |
Similar Demographics by In Labor Force | Age 20-64
Demographics Similar to Germans by In Labor Force | Age 20-64
In terms of in labor force | age 20-64, the demographic groups most similar to Germans are Immigrants from Cuba (79.7%, a difference of 0.010%), Moroccan (79.7%, a difference of 0.010%), South African (79.7%, a difference of 0.010%), Immigrants from Costa Rica (79.7%, a difference of 0.010%), and Immigrants from Burma/Myanmar (79.7%, a difference of 0.010%).
| Demographics | Rating | Rank | In Labor Force | Age 20-64 |
| Immigrants | South Africa | 69.2 /100 | #155 | Good 79.7% |
| Senegalese | 69.1 /100 | #156 | Good 79.7% |
| Immigrants | China | 69.1 /100 | #157 | Good 79.7% |
| Austrians | 67.6 /100 | #158 | Good 79.7% |
| Immigrants | Cuba | 66.7 /100 | #159 | Good 79.7% |
| Moroccans | 66.7 /100 | #160 | Good 79.7% |
| South Africans | 66.2 /100 | #161 | Good 79.7% |
| Germans | 65.2 /100 | #162 | Good 79.7% |
| Immigrants | Costa Rica | 64.6 /100 | #163 | Good 79.7% |
| Immigrants | Burma/Myanmar | 64.4 /100 | #164 | Good 79.7% |
| Nigerians | 64.0 /100 | #165 | Good 79.7% |
| Okinawans | 62.7 /100 | #166 | Good 79.6% |
| Immigrants | Iraq | 62.0 /100 | #167 | Good 79.6% |
| Immigrants | Indonesia | 61.8 /100 | #168 | Good 79.6% |
| Laotians | 58.4 /100 | #169 | Average 79.6% |
Demographics Similar to Celtics by In Labor Force | Age 20-64
In terms of in labor force | age 20-64, the demographic groups most similar to Celtics are Hawaiian (78.7%, a difference of 0.0%), Basque (78.7%, a difference of 0.020%), Immigrants from Lebanon (78.7%, a difference of 0.020%), Guatemalan (78.7%, a difference of 0.020%), and Immigrants from Guatemala (78.7%, a difference of 0.020%).
| Demographics | Rating | Rank | In Labor Force | Age 20-64 |
| English | 0.9 /100 | #249 | Tragic 78.8% |
| Hondurans | 0.8 /100 | #250 | Tragic 78.8% |
| Barbadians | 0.7 /100 | #251 | Tragic 78.8% |
| Immigrants | Honduras | 0.6 /100 | #252 | Tragic 78.7% |
| Basques | 0.5 /100 | #253 | Tragic 78.7% |
| Immigrants | Lebanon | 0.5 /100 | #254 | Tragic 78.7% |
| Hawaiians | 0.5 /100 | #255 | Tragic 78.7% |
| Celtics | 0.5 /100 | #256 | Tragic 78.7% |
| Guatemalans | 0.4 /100 | #257 | Tragic 78.7% |
| Immigrants | Guatemala | 0.4 /100 | #258 | Tragic 78.7% |
| Tsimshian | 0.4 /100 | #259 | Tragic 78.7% |
| Immigrants | Fiji | 0.3 /100 | #260 | Tragic 78.6% |
| Whites/Caucasians | 0.2 /100 | #261 | Tragic 78.5% |
| Fijians | 0.1 /100 | #262 | Tragic 78.4% |
| Pennsylvania Germans | 0.1 /100 | #263 | Tragic 78.4% |