Immigrants from Scotland vs Kiowa In Labor Force | Age 20-64
COMPARE
Immigrants from Scotland
Kiowa
In Labor Force | Age 20-64
In Labor Force | Age 20-64 Comparison
Immigrants from Scotland
Kiowa
79.6%
IN LABOR FORCE | AGE 20-64
52.4/ 100
METRIC RATING
173rd/ 347
METRIC RANK
75.0%
IN LABOR FORCE | AGE 20-64
0.0/ 100
METRIC RATING
328th/ 347
METRIC RANK
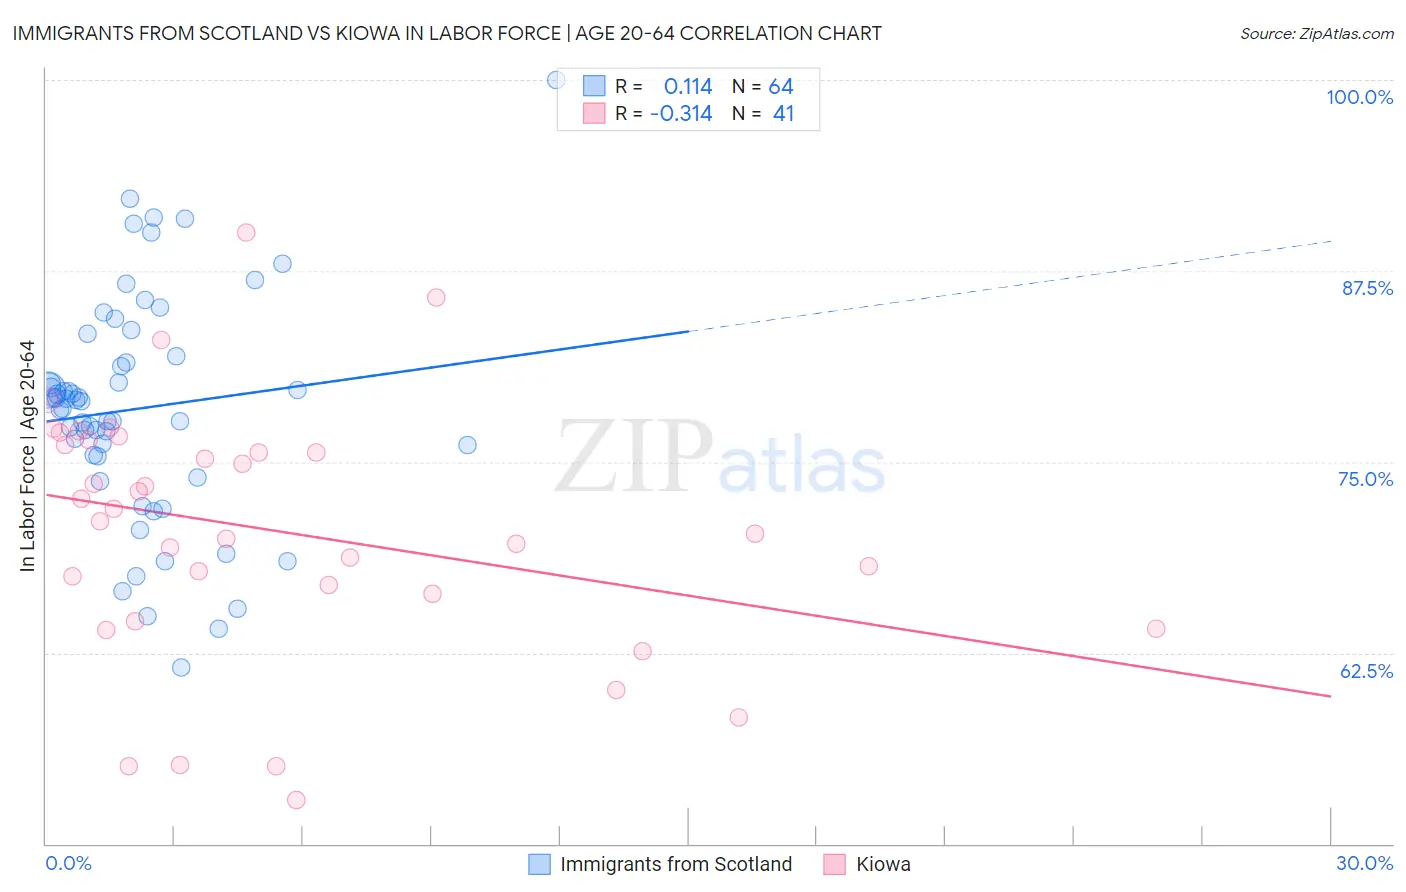
Immigrants from Scotland vs Kiowa In Labor Force | Age 20-64 Correlation Chart
The statistical analysis conducted on geographies consisting of 196,399,264 people shows a poor positive correlation between the proportion of Immigrants from Scotland and labor force participation rate among population between the ages 20 and 64 in the United States with a correlation coefficient (R) of 0.114 and weighted average of 79.6%. Similarly, the statistical analysis conducted on geographies consisting of 56,099,396 people shows a mild negative correlation between the proportion of Kiowa and labor force participation rate among population between the ages 20 and 64 in the United States with a correlation coefficient (R) of -0.314 and weighted average of 75.0%, a difference of 6.1%.
In Labor Force | Age 20-64 Correlation Summary
| Measurement | Immigrants from Scotland | Kiowa |
| Minimum | 61.5% | 52.9% |
| Maximum | 100.0% | 90.0% |
| Range | 38.5% | 37.1% |
| Mean | 78.5% | 70.5% |
| Median | 79.0% | 71.1% |
| Interquartile 25% (IQ1) | 75.4% | 65.5% |
| Interquartile 75% (IQ3) | 81.7% | 76.3% |
| Interquartile Range (IQR) | 6.3% | 10.8% |
| Standard Deviation (Sample) | 7.4% | 8.3% |
| Standard Deviation (Population) | 7.3% | 8.2% |
Similar Demographics by In Labor Force | Age 20-64
Demographics Similar to Immigrants from Scotland by In Labor Force | Age 20-64
In terms of in labor force | age 20-64, the demographic groups most similar to Immigrants from Scotland are Slavic (79.6%, a difference of 0.010%), Immigrants from Switzerland (79.6%, a difference of 0.010%), Immigrants from Belgium (79.6%, a difference of 0.010%), Syrian (79.6%, a difference of 0.020%), and Laotian (79.6%, a difference of 0.050%).
| Demographics | Rating | Rank | In Labor Force | Age 20-64 |
| Okinawans | 62.7 /100 | #166 | Good 79.6% |
| Immigrants | Iraq | 62.0 /100 | #167 | Good 79.6% |
| Immigrants | Indonesia | 61.8 /100 | #168 | Good 79.6% |
| Laotians | 58.4 /100 | #169 | Average 79.6% |
| Slavs | 54.0 /100 | #170 | Average 79.6% |
| Immigrants | Switzerland | 53.3 /100 | #171 | Average 79.6% |
| Immigrants | Belgium | 53.1 /100 | #172 | Average 79.6% |
| Immigrants | Scotland | 52.4 /100 | #173 | Average 79.6% |
| Syrians | 50.0 /100 | #174 | Average 79.6% |
| Cubans | 46.1 /100 | #175 | Average 79.5% |
| Australians | 46.0 /100 | #176 | Average 79.5% |
| Immigrants | Netherlands | 45.2 /100 | #177 | Average 79.5% |
| Czechoslovakians | 44.3 /100 | #178 | Average 79.5% |
| Armenians | 41.4 /100 | #179 | Average 79.5% |
| Salvadorans | 41.0 /100 | #180 | Average 79.5% |
Demographics Similar to Kiowa by In Labor Force | Age 20-64
In terms of in labor force | age 20-64, the demographic groups most similar to Kiowa are Sioux (75.0%, a difference of 0.030%), Creek (75.1%, a difference of 0.20%), Cheyenne (74.8%, a difference of 0.20%), Colville (74.8%, a difference of 0.26%), and Paiute (74.7%, a difference of 0.40%).
| Demographics | Rating | Rank | In Labor Force | Age 20-64 |
| Seminole | 0.0 /100 | #321 | Tragic 75.5% |
| Dutch West Indians | 0.0 /100 | #322 | Tragic 75.5% |
| Cajuns | 0.0 /100 | #323 | Tragic 75.5% |
| Choctaw | 0.0 /100 | #324 | Tragic 75.4% |
| Menominee | 0.0 /100 | #325 | Tragic 75.3% |
| Creek | 0.0 /100 | #326 | Tragic 75.1% |
| Sioux | 0.0 /100 | #327 | Tragic 75.0% |
| Kiowa | 0.0 /100 | #328 | Tragic 75.0% |
| Cheyenne | 0.0 /100 | #329 | Tragic 74.8% |
| Colville | 0.0 /100 | #330 | Tragic 74.8% |
| Paiute | 0.0 /100 | #331 | Tragic 74.7% |
| Arapaho | 0.0 /100 | #332 | Tragic 74.4% |
| Natives/Alaskans | 0.0 /100 | #333 | Tragic 73.9% |
| Apache | 0.0 /100 | #334 | Tragic 73.7% |
| Ute | 0.0 /100 | #335 | Tragic 73.7% |