Samoan vs Celtic In Labor Force | Age 20-64
COMPARE
Samoan
Celtic
In Labor Force | Age 20-64
In Labor Force | Age 20-64 Comparison
Samoans
Celtics
79.0%
IN LABOR FORCE | AGE 20-64
2.9/ 100
METRIC RATING
236th/ 347
METRIC RANK
78.7%
IN LABOR FORCE | AGE 20-64
0.5/ 100
METRIC RATING
256th/ 347
METRIC RANK
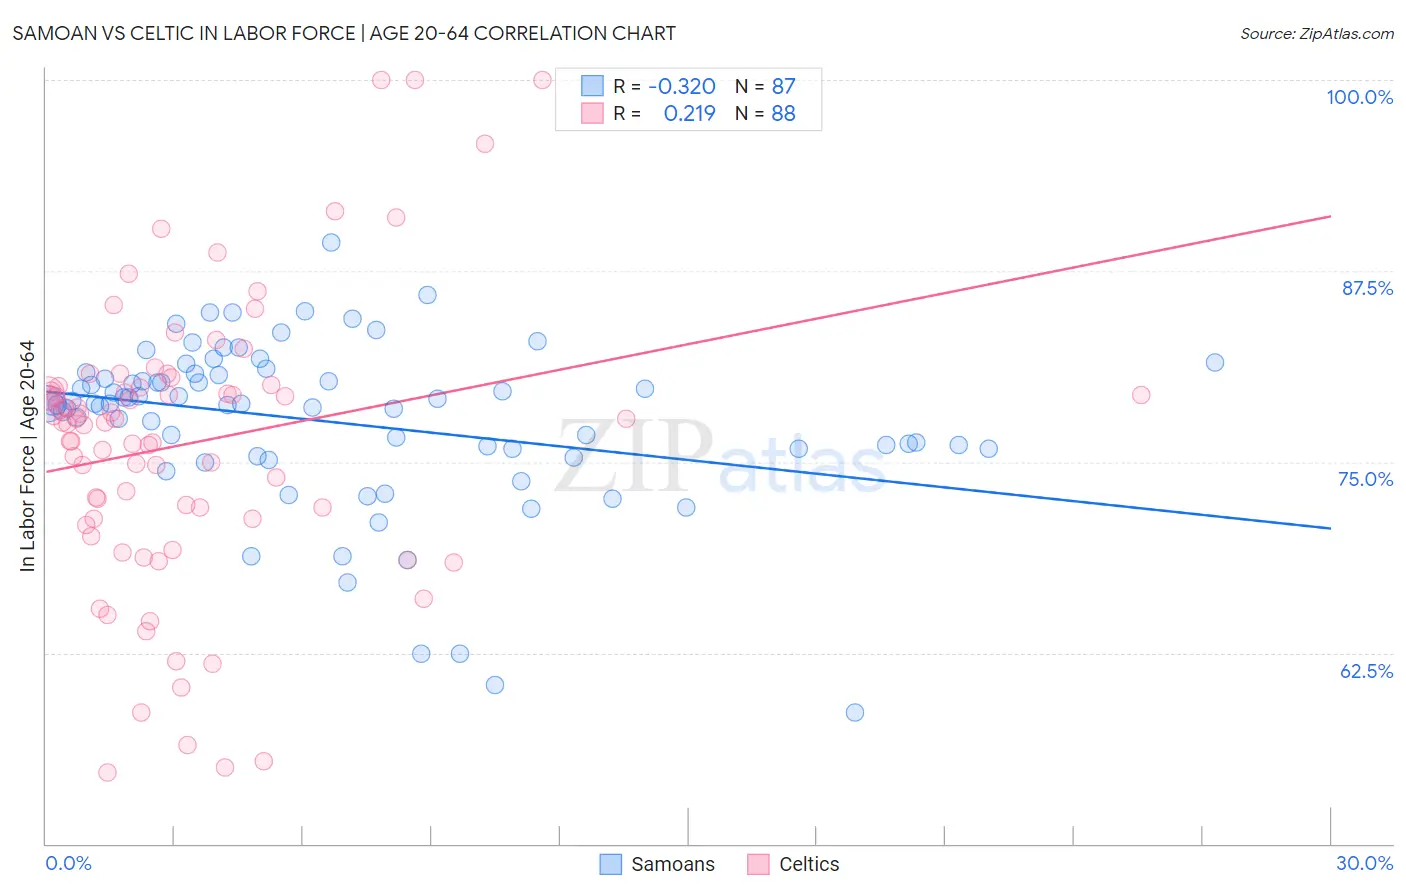
Samoan vs Celtic In Labor Force | Age 20-64 Correlation Chart
The statistical analysis conducted on geographies consisting of 225,189,054 people shows a mild negative correlation between the proportion of Samoans and labor force participation rate among population between the ages 20 and 64 in the United States with a correlation coefficient (R) of -0.320 and weighted average of 79.0%. Similarly, the statistical analysis conducted on geographies consisting of 168,869,465 people shows a weak positive correlation between the proportion of Celtics and labor force participation rate among population between the ages 20 and 64 in the United States with a correlation coefficient (R) of 0.219 and weighted average of 78.7%, a difference of 0.37%.
In Labor Force | Age 20-64 Correlation Summary
| Measurement | Samoan | Celtic |
| Minimum | 58.6% | 54.7% |
| Maximum | 89.4% | 100.0% |
| Range | 30.8% | 45.3% |
| Mean | 77.6% | 76.2% |
| Median | 78.8% | 77.6% |
| Interquartile 25% (IQ1) | 75.9% | 71.3% |
| Interquartile 75% (IQ3) | 80.7% | 79.9% |
| Interquartile Range (IQR) | 4.9% | 8.6% |
| Standard Deviation (Sample) | 5.5% | 9.3% |
| Standard Deviation (Population) | 5.5% | 9.3% |
Demographics Similar to Samoans and Celtics by In Labor Force | Age 20-64
In terms of in labor force | age 20-64, the demographic groups most similar to Samoans are Immigrants from North America (79.0%, a difference of 0.0%), Immigrants from Jamaica (79.0%, a difference of 0.030%), Welsh (79.0%, a difference of 0.040%), Trinidadian and Tobagonian (79.0%, a difference of 0.050%), and Jamaican (78.9%, a difference of 0.080%). Similarly, the demographic groups most similar to Celtics are Hawaiian (78.7%, a difference of 0.0%), Basque (78.7%, a difference of 0.020%), Immigrants from Lebanon (78.7%, a difference of 0.020%), Immigrants from Honduras (78.7%, a difference of 0.040%), and Barbadian (78.8%, a difference of 0.090%).
| Demographics | Rating | Rank | In Labor Force | Age 20-64 |
| Samoans | 2.9 /100 | #236 | Tragic 79.0% |
| Immigrants | North America | 2.9 /100 | #237 | Tragic 79.0% |
| Immigrants | Jamaica | 2.6 /100 | #238 | Tragic 79.0% |
| Welsh | 2.4 /100 | #239 | Tragic 79.0% |
| Trinidadians and Tobagonians | 2.3 /100 | #240 | Tragic 79.0% |
| Jamaicans | 2.0 /100 | #241 | Tragic 78.9% |
| Immigrants | Micronesia | 1.9 /100 | #242 | Tragic 78.9% |
| Immigrants | West Indies | 1.7 /100 | #243 | Tragic 78.9% |
| French | 1.5 /100 | #244 | Tragic 78.9% |
| Scottish | 1.3 /100 | #245 | Tragic 78.9% |
| Immigrants | Trinidad and Tobago | 1.1 /100 | #246 | Tragic 78.8% |
| Immigrants | Germany | 1.0 /100 | #247 | Tragic 78.8% |
| Immigrants | Caribbean | 1.0 /100 | #248 | Tragic 78.8% |
| English | 0.9 /100 | #249 | Tragic 78.8% |
| Hondurans | 0.8 /100 | #250 | Tragic 78.8% |
| Barbadians | 0.7 /100 | #251 | Tragic 78.8% |
| Immigrants | Honduras | 0.6 /100 | #252 | Tragic 78.7% |
| Basques | 0.5 /100 | #253 | Tragic 78.7% |
| Immigrants | Lebanon | 0.5 /100 | #254 | Tragic 78.7% |
| Hawaiians | 0.5 /100 | #255 | Tragic 78.7% |
| Celtics | 0.5 /100 | #256 | Tragic 78.7% |