Immigrants from Scotland vs Celtic 8th Grade
COMPARE
Immigrants from Scotland
Celtic
8th Grade
8th Grade Comparison
Immigrants from Scotland
Celtics
96.8%
8TH GRADE
99.9/ 100
METRIC RATING
50th/ 347
METRIC RANK
96.8%
8TH GRADE
99.9/ 100
METRIC RATING
51st/ 347
METRIC RANK
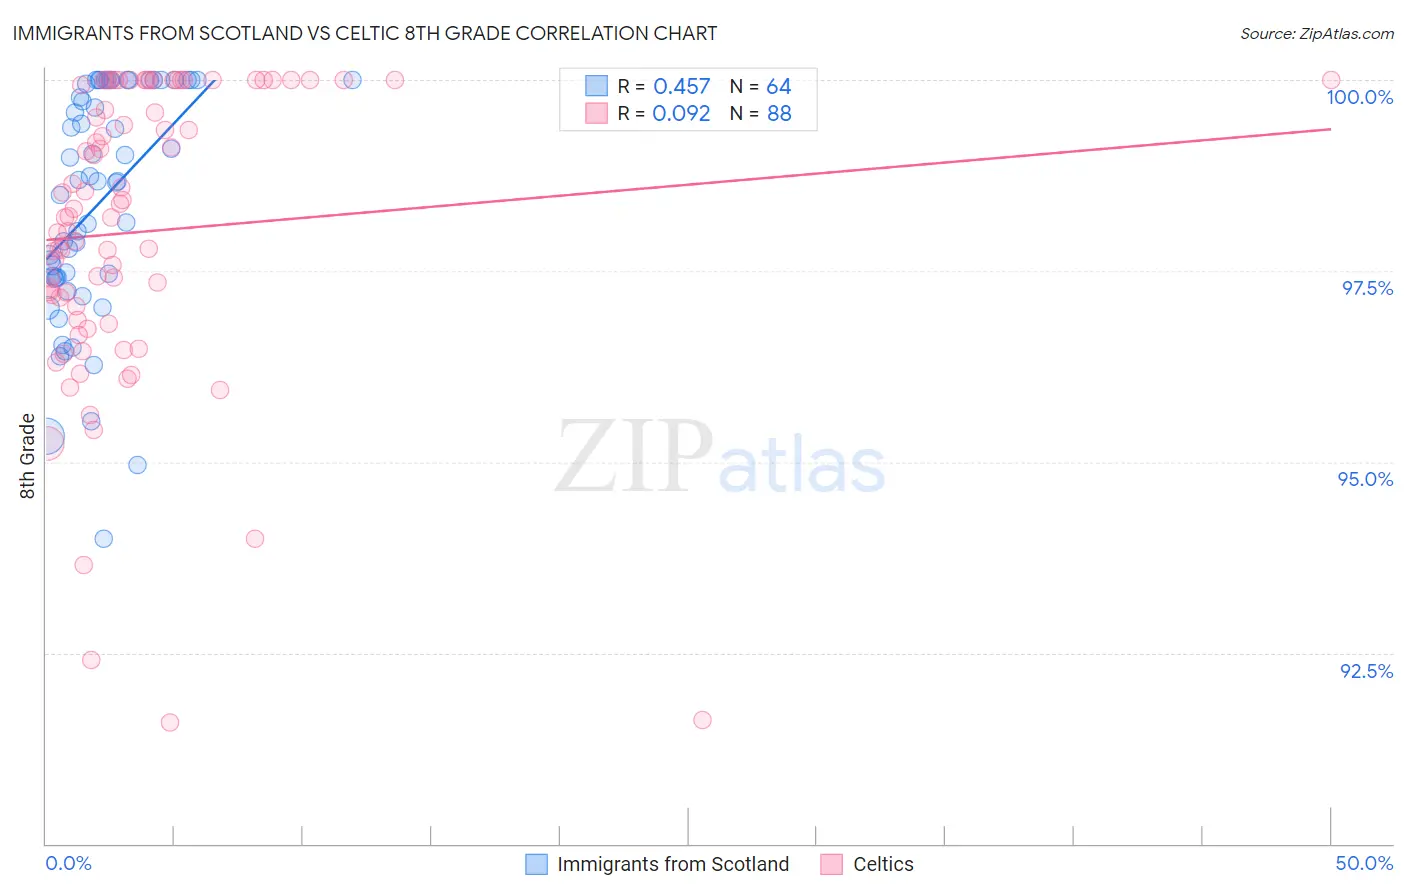
Immigrants from Scotland vs Celtic 8th Grade Correlation Chart
The statistical analysis conducted on geographies consisting of 196,398,887 people shows a moderate positive correlation between the proportion of Immigrants from Scotland and percentage of population with at least 8th grade education in the United States with a correlation coefficient (R) of 0.457 and weighted average of 96.8%. Similarly, the statistical analysis conducted on geographies consisting of 168,876,981 people shows a slight positive correlation between the proportion of Celtics and percentage of population with at least 8th grade education in the United States with a correlation coefficient (R) of 0.092 and weighted average of 96.8%, a difference of 0.010%.
8th Grade Correlation Summary
| Measurement | Immigrants from Scotland | Celtic |
| Minimum | 94.0% | 91.6% |
| Maximum | 100.0% | 100.0% |
| Range | 6.0% | 8.4% |
| Mean | 98.4% | 98.0% |
| Median | 98.7% | 98.2% |
| Interquartile 25% (IQ1) | 97.4% | 96.9% |
| Interquartile 75% (IQ3) | 100.0% | 100.0% |
| Interquartile Range (IQR) | 2.6% | 3.1% |
| Standard Deviation (Sample) | 1.5% | 1.9% |
| Standard Deviation (Population) | 1.5% | 1.9% |
Demographics Similar to Immigrants from Scotland and Celtics by 8th Grade
In terms of 8th grade, the demographic groups most similar to Immigrants from Scotland are Estonian (96.8%, a difference of 0.010%), Slavic (96.8%, a difference of 0.020%), Greek (96.8%, a difference of 0.040%), Bulgarian (96.9%, a difference of 0.050%), and Czechoslovakian (96.9%, a difference of 0.060%). Similarly, the demographic groups most similar to Celtics are Estonian (96.8%, a difference of 0.020%), Slavic (96.8%, a difference of 0.030%), Greek (96.8%, a difference of 0.030%), Austrian (96.7%, a difference of 0.050%), and Serbian (96.7%, a difference of 0.050%).
| Demographics | Rating | Rank | 8th Grade |
| Inupiat | 100.0 /100 | #40 | Exceptional 97.0% |
| Eastern Europeans | 100.0 /100 | #41 | Exceptional 97.0% |
| Chinese | 100.0 /100 | #42 | Exceptional 96.9% |
| Aleuts | 99.9 /100 | #43 | Exceptional 96.9% |
| Maltese | 99.9 /100 | #44 | Exceptional 96.9% |
| Northern Europeans | 99.9 /100 | #45 | Exceptional 96.9% |
| Czechoslovakians | 99.9 /100 | #46 | Exceptional 96.9% |
| Bulgarians | 99.9 /100 | #47 | Exceptional 96.9% |
| Slavs | 99.9 /100 | #48 | Exceptional 96.8% |
| Estonians | 99.9 /100 | #49 | Exceptional 96.8% |
| Immigrants | Scotland | 99.9 /100 | #50 | Exceptional 96.8% |
| Celtics | 99.9 /100 | #51 | Exceptional 96.8% |
| Greeks | 99.9 /100 | #52 | Exceptional 96.8% |
| Austrians | 99.9 /100 | #53 | Exceptional 96.7% |
| Serbians | 99.8 /100 | #54 | Exceptional 96.7% |
| Russians | 99.8 /100 | #55 | Exceptional 96.7% |
| Australians | 99.8 /100 | #56 | Exceptional 96.7% |
| Macedonians | 99.8 /100 | #57 | Exceptional 96.7% |
| Immigrants | Canada | 99.8 /100 | #58 | Exceptional 96.7% |
| Immigrants | North America | 99.8 /100 | #59 | Exceptional 96.7% |
| Immigrants | Northern Europe | 99.8 /100 | #60 | Exceptional 96.7% |