Immigrants from Vietnam vs Celtic In Labor Force | Age 20-64
COMPARE
Immigrants from Vietnam
Celtic
In Labor Force | Age 20-64
In Labor Force | Age 20-64 Comparison
Immigrants from Vietnam
Celtics
80.0%
IN LABOR FORCE | AGE 20-64
92.7/ 100
METRIC RATING
117th/ 347
METRIC RANK
78.7%
IN LABOR FORCE | AGE 20-64
0.5/ 100
METRIC RATING
256th/ 347
METRIC RANK
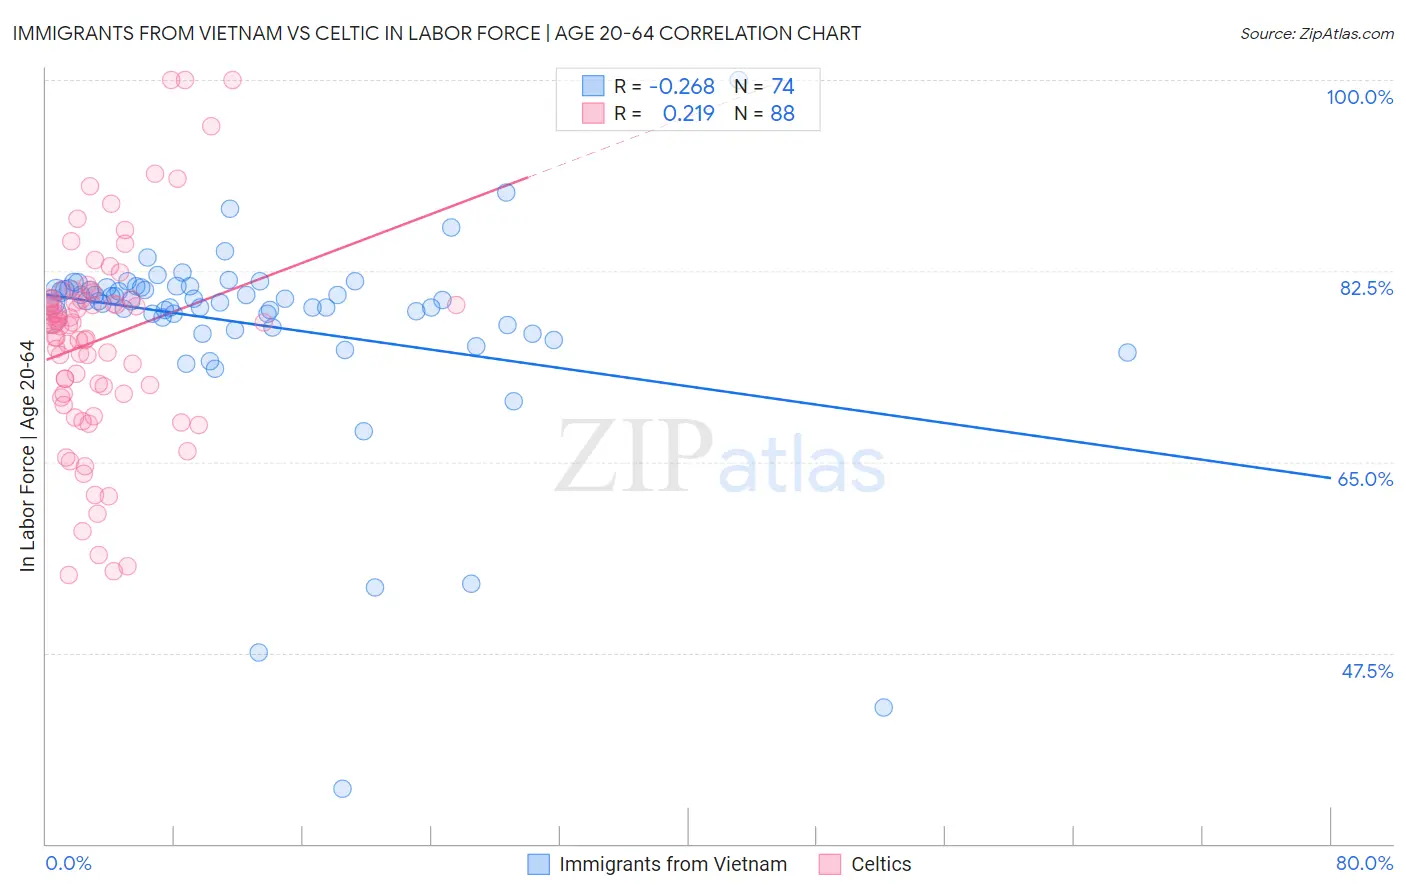
Immigrants from Vietnam vs Celtic In Labor Force | Age 20-64 Correlation Chart
The statistical analysis conducted on geographies consisting of 404,837,038 people shows a weak negative correlation between the proportion of Immigrants from Vietnam and labor force participation rate among population between the ages 20 and 64 in the United States with a correlation coefficient (R) of -0.268 and weighted average of 80.0%. Similarly, the statistical analysis conducted on geographies consisting of 168,869,465 people shows a weak positive correlation between the proportion of Celtics and labor force participation rate among population between the ages 20 and 64 in the United States with a correlation coefficient (R) of 0.219 and weighted average of 78.7%, a difference of 1.6%.
In Labor Force | Age 20-64 Correlation Summary
| Measurement | Immigrants from Vietnam | Celtic |
| Minimum | 35.0% | 54.7% |
| Maximum | 100.0% | 100.0% |
| Range | 65.0% | 45.3% |
| Mean | 77.6% | 76.2% |
| Median | 79.7% | 77.6% |
| Interquartile 25% (IQ1) | 77.6% | 71.3% |
| Interquartile 75% (IQ3) | 81.0% | 79.9% |
| Interquartile Range (IQR) | 3.4% | 8.6% |
| Standard Deviation (Sample) | 9.5% | 9.3% |
| Standard Deviation (Population) | 9.4% | 9.3% |
Similar Demographics by In Labor Force | Age 20-64
Demographics Similar to Immigrants from Vietnam by In Labor Force | Age 20-64
In terms of in labor force | age 20-64, the demographic groups most similar to Immigrants from Vietnam are Cape Verdean (80.0%, a difference of 0.0%), Immigrants from Western Africa (80.0%, a difference of 0.010%), Immigrants from Taiwan (80.0%, a difference of 0.010%), Maltese (80.0%, a difference of 0.010%), and Immigrants from Kuwait (80.0%, a difference of 0.010%).
| Demographics | Rating | Rank | In Labor Force | Age 20-64 |
| Estonians | 94.0 /100 | #110 | Exceptional 80.0% |
| Immigrants | South America | 93.9 /100 | #111 | Exceptional 80.0% |
| Immigrants | Italy | 93.9 /100 | #112 | Exceptional 80.0% |
| Sri Lankans | 93.9 /100 | #113 | Exceptional 80.0% |
| Argentineans | 93.8 /100 | #114 | Exceptional 80.0% |
| Bermudans | 93.3 /100 | #115 | Exceptional 80.0% |
| Immigrants | Western Africa | 93.1 /100 | #116 | Exceptional 80.0% |
| Immigrants | Vietnam | 92.7 /100 | #117 | Exceptional 80.0% |
| Cape Verdeans | 92.7 /100 | #118 | Exceptional 80.0% |
| Immigrants | Taiwan | 92.5 /100 | #119 | Exceptional 80.0% |
| Maltese | 92.4 /100 | #120 | Exceptional 80.0% |
| Immigrants | Kuwait | 92.2 /100 | #121 | Exceptional 80.0% |
| Mongolians | 92.0 /100 | #122 | Exceptional 79.9% |
| Immigrants | Russia | 91.8 /100 | #123 | Exceptional 79.9% |
| Immigrants | Europe | 91.6 /100 | #124 | Exceptional 79.9% |
Demographics Similar to Celtics by In Labor Force | Age 20-64
In terms of in labor force | age 20-64, the demographic groups most similar to Celtics are Hawaiian (78.7%, a difference of 0.0%), Basque (78.7%, a difference of 0.020%), Immigrants from Lebanon (78.7%, a difference of 0.020%), Guatemalan (78.7%, a difference of 0.020%), and Immigrants from Guatemala (78.7%, a difference of 0.020%).
| Demographics | Rating | Rank | In Labor Force | Age 20-64 |
| English | 0.9 /100 | #249 | Tragic 78.8% |
| Hondurans | 0.8 /100 | #250 | Tragic 78.8% |
| Barbadians | 0.7 /100 | #251 | Tragic 78.8% |
| Immigrants | Honduras | 0.6 /100 | #252 | Tragic 78.7% |
| Basques | 0.5 /100 | #253 | Tragic 78.7% |
| Immigrants | Lebanon | 0.5 /100 | #254 | Tragic 78.7% |
| Hawaiians | 0.5 /100 | #255 | Tragic 78.7% |
| Celtics | 0.5 /100 | #256 | Tragic 78.7% |
| Guatemalans | 0.4 /100 | #257 | Tragic 78.7% |
| Immigrants | Guatemala | 0.4 /100 | #258 | Tragic 78.7% |
| Tsimshian | 0.4 /100 | #259 | Tragic 78.7% |
| Immigrants | Fiji | 0.3 /100 | #260 | Tragic 78.6% |
| Whites/Caucasians | 0.2 /100 | #261 | Tragic 78.5% |
| Fijians | 0.1 /100 | #262 | Tragic 78.4% |
| Pennsylvania Germans | 0.1 /100 | #263 | Tragic 78.4% |