Immigrants from Greece vs Celtic In Labor Force | Age 20-64
COMPARE
Immigrants from Greece
Celtic
In Labor Force | Age 20-64
In Labor Force | Age 20-64 Comparison
Immigrants from Greece
Celtics
80.4%
IN LABOR FORCE | AGE 20-64
99.4/ 100
METRIC RATING
49th/ 347
METRIC RANK
78.7%
IN LABOR FORCE | AGE 20-64
0.5/ 100
METRIC RATING
256th/ 347
METRIC RANK
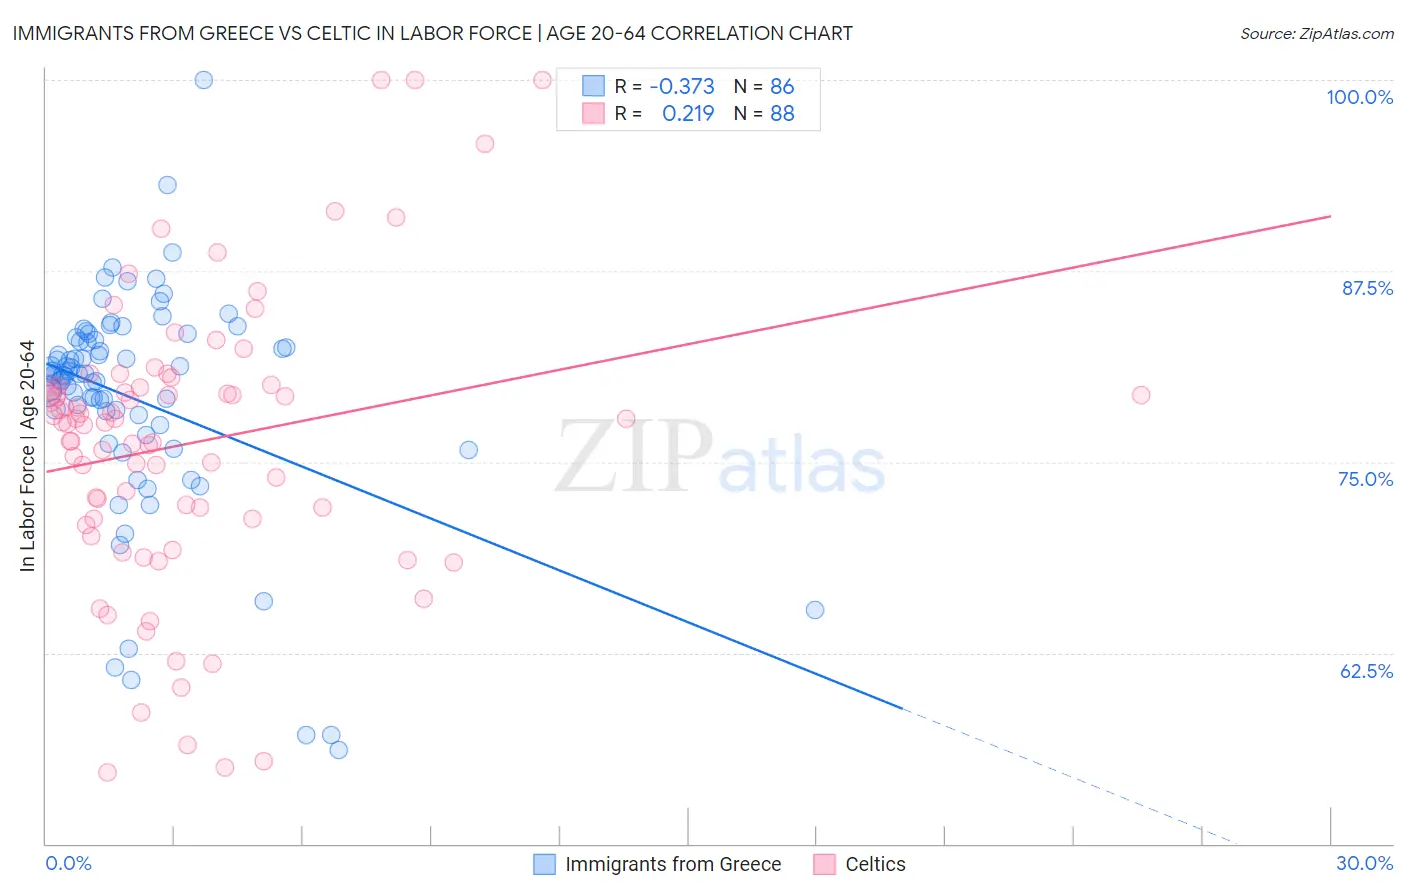
Immigrants from Greece vs Celtic In Labor Force | Age 20-64 Correlation Chart
The statistical analysis conducted on geographies consisting of 216,878,258 people shows a mild negative correlation between the proportion of Immigrants from Greece and labor force participation rate among population between the ages 20 and 64 in the United States with a correlation coefficient (R) of -0.373 and weighted average of 80.4%. Similarly, the statistical analysis conducted on geographies consisting of 168,869,465 people shows a weak positive correlation between the proportion of Celtics and labor force participation rate among population between the ages 20 and 64 in the United States with a correlation coefficient (R) of 0.219 and weighted average of 78.7%, a difference of 2.1%.
In Labor Force | Age 20-64 Correlation Summary
| Measurement | Immigrants from Greece | Celtic |
| Minimum | 56.1% | 54.7% |
| Maximum | 100.0% | 100.0% |
| Range | 43.9% | 45.3% |
| Mean | 79.1% | 76.2% |
| Median | 80.7% | 77.6% |
| Interquartile 25% (IQ1) | 77.4% | 71.3% |
| Interquartile 75% (IQ3) | 83.0% | 79.9% |
| Interquartile Range (IQR) | 5.6% | 8.6% |
| Standard Deviation (Sample) | 7.5% | 9.3% |
| Standard Deviation (Population) | 7.4% | 9.3% |
Similar Demographics by In Labor Force | Age 20-64
Demographics Similar to Immigrants from Greece by In Labor Force | Age 20-64
In terms of in labor force | age 20-64, the demographic groups most similar to Immigrants from Greece are Immigrants from Sudan (80.4%, a difference of 0.020%), Immigrants from Hong Kong (80.4%, a difference of 0.040%), Immigrants from Sri Lanka (80.4%, a difference of 0.040%), Immigrants from Africa (80.4%, a difference of 0.060%), and Turkish (80.3%, a difference of 0.060%).
| Demographics | Rating | Rank | In Labor Force | Age 20-64 |
| Latvians | 99.8 /100 | #42 | Exceptional 80.5% |
| Czechs | 99.7 /100 | #43 | Exceptional 80.5% |
| Immigrants | Middle Africa | 99.7 /100 | #44 | Exceptional 80.5% |
| Slovenes | 99.7 /100 | #45 | Exceptional 80.5% |
| Immigrants | Pakistan | 99.6 /100 | #46 | Exceptional 80.5% |
| Immigrants | Africa | 99.6 /100 | #47 | Exceptional 80.4% |
| Immigrants | Hong Kong | 99.5 /100 | #48 | Exceptional 80.4% |
| Immigrants | Greece | 99.4 /100 | #49 | Exceptional 80.4% |
| Immigrants | Sudan | 99.4 /100 | #50 | Exceptional 80.4% |
| Immigrants | Sri Lanka | 99.3 /100 | #51 | Exceptional 80.4% |
| Turks | 99.2 /100 | #52 | Exceptional 80.3% |
| Immigrants | Peru | 99.2 /100 | #53 | Exceptional 80.3% |
| Peruvians | 99.1 /100 | #54 | Exceptional 80.3% |
| Immigrants | Cabo Verde | 99.0 /100 | #55 | Exceptional 80.3% |
| Immigrants | Northern Africa | 99.0 /100 | #56 | Exceptional 80.3% |
Demographics Similar to Celtics by In Labor Force | Age 20-64
In terms of in labor force | age 20-64, the demographic groups most similar to Celtics are Hawaiian (78.7%, a difference of 0.0%), Basque (78.7%, a difference of 0.020%), Immigrants from Lebanon (78.7%, a difference of 0.020%), Guatemalan (78.7%, a difference of 0.020%), and Immigrants from Guatemala (78.7%, a difference of 0.020%).
| Demographics | Rating | Rank | In Labor Force | Age 20-64 |
| English | 0.9 /100 | #249 | Tragic 78.8% |
| Hondurans | 0.8 /100 | #250 | Tragic 78.8% |
| Barbadians | 0.7 /100 | #251 | Tragic 78.8% |
| Immigrants | Honduras | 0.6 /100 | #252 | Tragic 78.7% |
| Basques | 0.5 /100 | #253 | Tragic 78.7% |
| Immigrants | Lebanon | 0.5 /100 | #254 | Tragic 78.7% |
| Hawaiians | 0.5 /100 | #255 | Tragic 78.7% |
| Celtics | 0.5 /100 | #256 | Tragic 78.7% |
| Guatemalans | 0.4 /100 | #257 | Tragic 78.7% |
| Immigrants | Guatemala | 0.4 /100 | #258 | Tragic 78.7% |
| Tsimshian | 0.4 /100 | #259 | Tragic 78.7% |
| Immigrants | Fiji | 0.3 /100 | #260 | Tragic 78.6% |
| Whites/Caucasians | 0.2 /100 | #261 | Tragic 78.5% |
| Fijians | 0.1 /100 | #262 | Tragic 78.4% |
| Pennsylvania Germans | 0.1 /100 | #263 | Tragic 78.4% |