Dominican vs Immigrants from Korea In Labor Force | Age > 16
COMPARE
Dominican
Immigrants from Korea
In Labor Force | Age > 16
In Labor Force | Age > 16 Comparison
Dominicans
Immigrants from Korea
64.1%
IN LABOR FORCE | AGE > 16
0.4/ 100
METRIC RATING
271st/ 347
METRIC RANK
66.2%
IN LABOR FORCE | AGE > 16
99.7/ 100
METRIC RATING
74th/ 347
METRIC RANK
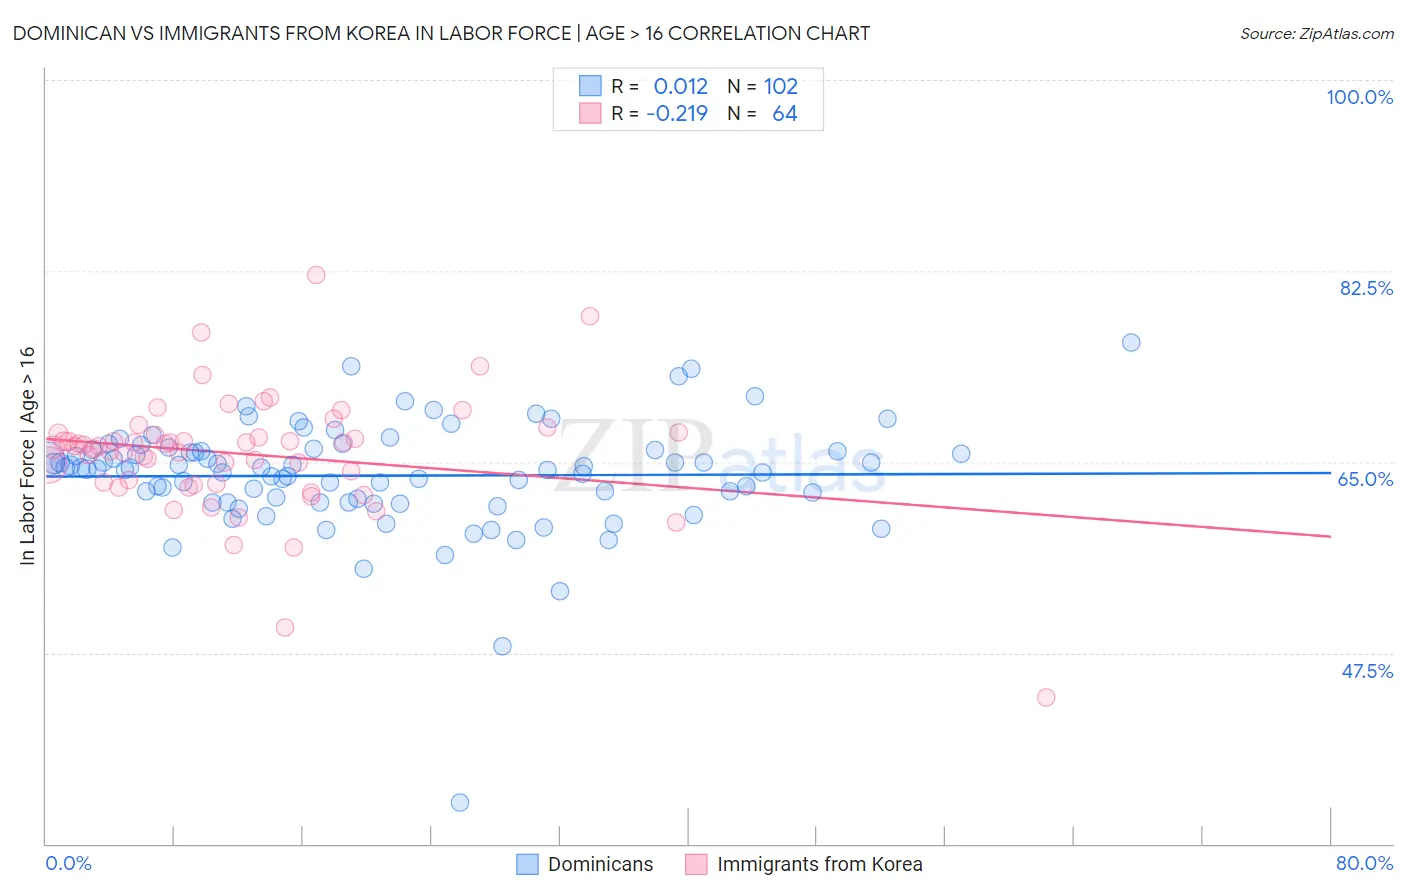
Dominican vs Immigrants from Korea In Labor Force | Age > 16 Correlation Chart
The statistical analysis conducted on geographies consisting of 355,150,180 people shows no correlation between the proportion of Dominicans and labor force participation rate among population ages 16 and over in the United States with a correlation coefficient (R) of 0.012 and weighted average of 64.1%. Similarly, the statistical analysis conducted on geographies consisting of 416,355,366 people shows a weak negative correlation between the proportion of Immigrants from Korea and labor force participation rate among population ages 16 and over in the United States with a correlation coefficient (R) of -0.219 and weighted average of 66.2%, a difference of 3.3%.
In Labor Force | Age > 16 Correlation Summary
| Measurement | Dominican | Immigrants from Korea |
| Minimum | 33.8% | 43.4% |
| Maximum | 75.9% | 82.1% |
| Range | 42.1% | 38.7% |
| Mean | 63.7% | 65.7% |
| Median | 64.4% | 66.5% |
| Interquartile 25% (IQ1) | 61.3% | 63.1% |
| Interquartile 75% (IQ3) | 66.1% | 67.5% |
| Interquartile Range (IQR) | 4.8% | 4.5% |
| Standard Deviation (Sample) | 5.2% | 5.6% |
| Standard Deviation (Population) | 5.2% | 5.6% |
Similar Demographics by In Labor Force | Age > 16
Demographics Similar to Dominicans by In Labor Force | Age > 16
In terms of in labor force | age > 16, the demographic groups most similar to Dominicans are Guyanese (64.1%, a difference of 0.0%), Irish (64.1%, a difference of 0.030%), Native Hawaiian (64.1%, a difference of 0.030%), Hmong (64.1%, a difference of 0.030%), and Immigrants from Cuba (64.1%, a difference of 0.040%).
| Demographics | Rating | Rank | In Labor Force | Age > 16 |
| Dutch | 0.6 /100 | #264 | Tragic 64.2% |
| Cubans | 0.5 /100 | #265 | Tragic 64.2% |
| Immigrants | England | 0.5 /100 | #266 | Tragic 64.2% |
| Canadians | 0.5 /100 | #267 | Tragic 64.1% |
| Spaniards | 0.5 /100 | #268 | Tragic 64.1% |
| Irish | 0.4 /100 | #269 | Tragic 64.1% |
| Guyanese | 0.4 /100 | #270 | Tragic 64.1% |
| Dominicans | 0.4 /100 | #271 | Tragic 64.1% |
| Native Hawaiians | 0.3 /100 | #272 | Tragic 64.1% |
| Hmong | 0.3 /100 | #273 | Tragic 64.1% |
| Immigrants | Cuba | 0.3 /100 | #274 | Tragic 64.1% |
| Mexicans | 0.3 /100 | #275 | Tragic 64.1% |
| French American Indians | 0.3 /100 | #276 | Tragic 64.1% |
| Immigrants | Bahamas | 0.3 /100 | #277 | Tragic 64.0% |
| Assyrians/Chaldeans/Syriacs | 0.3 /100 | #278 | Tragic 64.0% |
Demographics Similar to Immigrants from Korea by In Labor Force | Age > 16
In terms of in labor force | age > 16, the demographic groups most similar to Immigrants from Korea are Immigrants from Vietnam (66.2%, a difference of 0.0%), Burmese (66.2%, a difference of 0.010%), Taiwanese (66.2%, a difference of 0.010%), Immigrants from Singapore (66.2%, a difference of 0.010%), and Asian (66.2%, a difference of 0.030%).
| Demographics | Rating | Rank | In Labor Force | Age > 16 |
| Egyptians | 99.8 /100 | #67 | Exceptional 66.2% |
| Immigrants | Egypt | 99.7 /100 | #68 | Exceptional 66.2% |
| Sub-Saharan Africans | 99.7 /100 | #69 | Exceptional 66.2% |
| Asians | 99.7 /100 | #70 | Exceptional 66.2% |
| Burmese | 99.7 /100 | #71 | Exceptional 66.2% |
| Taiwanese | 99.7 /100 | #72 | Exceptional 66.2% |
| Immigrants | Vietnam | 99.7 /100 | #73 | Exceptional 66.2% |
| Immigrants | Korea | 99.7 /100 | #74 | Exceptional 66.2% |
| Immigrants | Singapore | 99.7 /100 | #75 | Exceptional 66.2% |
| Immigrants | Malaysia | 99.6 /100 | #76 | Exceptional 66.1% |
| Immigrants | Moldova | 99.6 /100 | #77 | Exceptional 66.1% |
| Immigrants | Asia | 99.6 /100 | #78 | Exceptional 66.1% |
| Turks | 99.6 /100 | #79 | Exceptional 66.1% |
| Malaysians | 99.6 /100 | #80 | Exceptional 66.1% |
| Moroccans | 99.5 /100 | #81 | Exceptional 66.1% |