Immigrants from Latin America vs Immigrants from Korea In Labor Force | Age > 16
COMPARE
Immigrants from Latin America
Immigrants from Korea
In Labor Force | Age > 16
In Labor Force | Age > 16 Comparison
Immigrants from Latin America
Immigrants from Korea
64.8%
IN LABOR FORCE | AGE > 16
16.4/ 100
METRIC RATING
207th/ 347
METRIC RANK
66.2%
IN LABOR FORCE | AGE > 16
99.7/ 100
METRIC RATING
74th/ 347
METRIC RANK
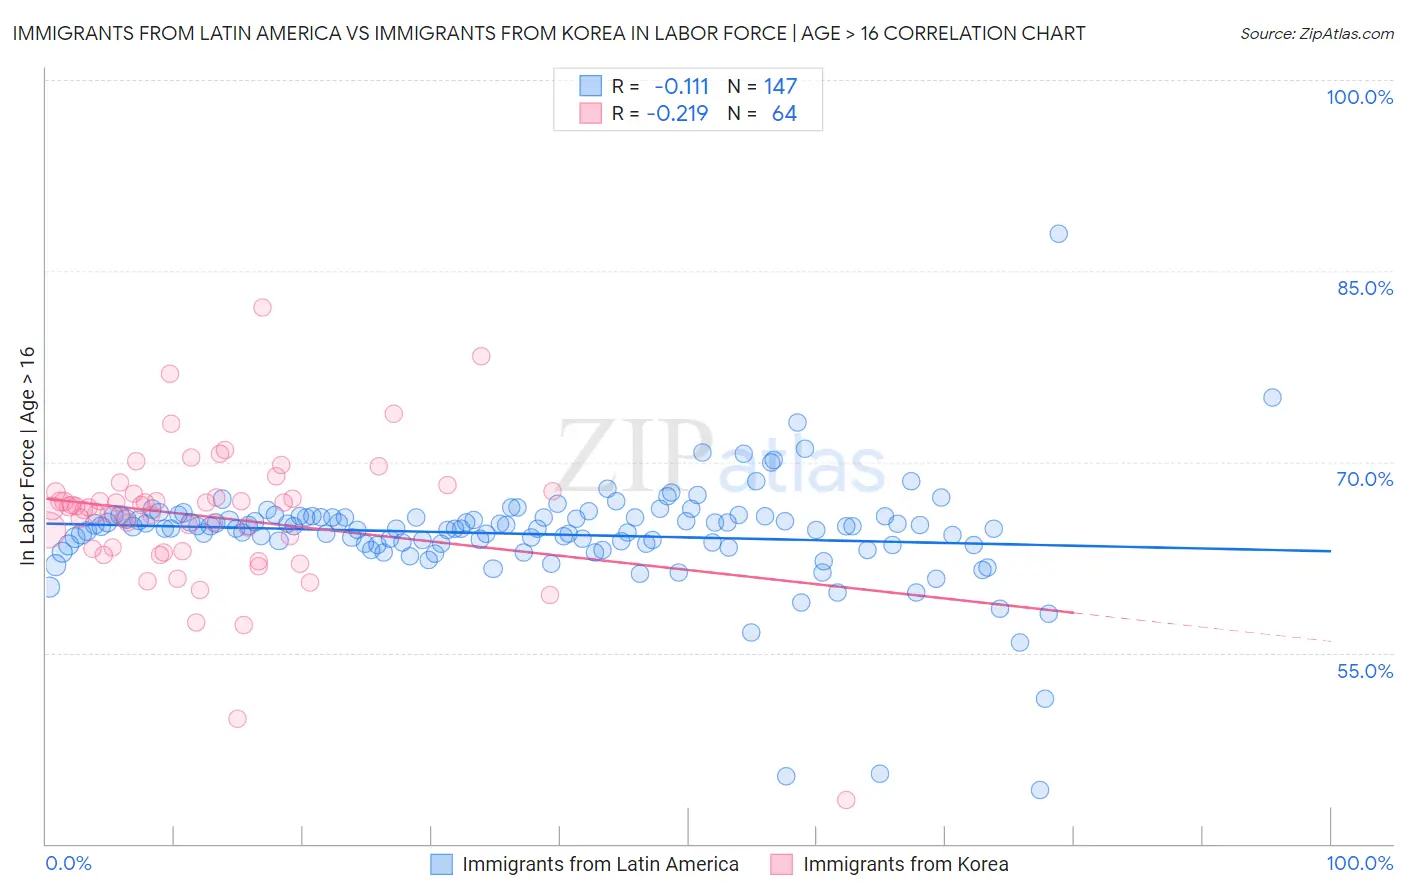
Immigrants from Latin America vs Immigrants from Korea In Labor Force | Age > 16 Correlation Chart
The statistical analysis conducted on geographies consisting of 558,618,478 people shows a poor negative correlation between the proportion of Immigrants from Latin America and labor force participation rate among population ages 16 and over in the United States with a correlation coefficient (R) of -0.111 and weighted average of 64.8%. Similarly, the statistical analysis conducted on geographies consisting of 416,355,366 people shows a weak negative correlation between the proportion of Immigrants from Korea and labor force participation rate among population ages 16 and over in the United States with a correlation coefficient (R) of -0.219 and weighted average of 66.2%, a difference of 2.1%.
In Labor Force | Age > 16 Correlation Summary
| Measurement | Immigrants from Latin America | Immigrants from Korea |
| Minimum | 44.2% | 43.4% |
| Maximum | 87.9% | 82.1% |
| Range | 43.7% | 38.7% |
| Mean | 64.3% | 65.7% |
| Median | 64.8% | 66.5% |
| Interquartile 25% (IQ1) | 63.5% | 63.1% |
| Interquartile 75% (IQ3) | 65.7% | 67.5% |
| Interquartile Range (IQR) | 2.2% | 4.5% |
| Standard Deviation (Sample) | 4.4% | 5.6% |
| Standard Deviation (Population) | 4.4% | 5.6% |
Similar Demographics by In Labor Force | Age > 16
Demographics Similar to Immigrants from Latin America by In Labor Force | Age > 16
In terms of in labor force | age > 16, the demographic groups most similar to Immigrants from Latin America are Belizean (64.8%, a difference of 0.010%), Lithuanian (64.8%, a difference of 0.020%), Immigrants from Trinidad and Tobago (64.8%, a difference of 0.020%), Slovene (64.9%, a difference of 0.040%), and Jamaican (64.9%, a difference of 0.040%).
| Demographics | Rating | Rank | In Labor Force | Age > 16 |
| Armenians | 20.2 /100 | #200 | Fair 64.9% |
| Ukrainians | 19.6 /100 | #201 | Poor 64.9% |
| Immigrants | Belgium | 19.4 /100 | #202 | Poor 64.9% |
| Russians | 18.8 /100 | #203 | Poor 64.9% |
| Slovenes | 18.7 /100 | #204 | Poor 64.9% |
| Jamaicans | 18.7 /100 | #205 | Poor 64.9% |
| Lithuanians | 17.4 /100 | #206 | Poor 64.8% |
| Immigrants | Latin America | 16.4 /100 | #207 | Poor 64.8% |
| Belizeans | 16.2 /100 | #208 | Poor 64.8% |
| Immigrants | Trinidad and Tobago | 15.6 /100 | #209 | Poor 64.8% |
| Immigrants | Denmark | 14.7 /100 | #210 | Poor 64.8% |
| Fijians | 14.1 /100 | #211 | Poor 64.8% |
| Alaskan Athabascans | 13.9 /100 | #212 | Poor 64.8% |
| Maltese | 13.8 /100 | #213 | Poor 64.8% |
| Estonians | 13.1 /100 | #214 | Poor 64.8% |
Demographics Similar to Immigrants from Korea by In Labor Force | Age > 16
In terms of in labor force | age > 16, the demographic groups most similar to Immigrants from Korea are Immigrants from Vietnam (66.2%, a difference of 0.0%), Burmese (66.2%, a difference of 0.010%), Taiwanese (66.2%, a difference of 0.010%), Immigrants from Singapore (66.2%, a difference of 0.010%), and Asian (66.2%, a difference of 0.030%).
| Demographics | Rating | Rank | In Labor Force | Age > 16 |
| Egyptians | 99.8 /100 | #67 | Exceptional 66.2% |
| Immigrants | Egypt | 99.7 /100 | #68 | Exceptional 66.2% |
| Sub-Saharan Africans | 99.7 /100 | #69 | Exceptional 66.2% |
| Asians | 99.7 /100 | #70 | Exceptional 66.2% |
| Burmese | 99.7 /100 | #71 | Exceptional 66.2% |
| Taiwanese | 99.7 /100 | #72 | Exceptional 66.2% |
| Immigrants | Vietnam | 99.7 /100 | #73 | Exceptional 66.2% |
| Immigrants | Korea | 99.7 /100 | #74 | Exceptional 66.2% |
| Immigrants | Singapore | 99.7 /100 | #75 | Exceptional 66.2% |
| Immigrants | Malaysia | 99.6 /100 | #76 | Exceptional 66.1% |
| Immigrants | Moldova | 99.6 /100 | #77 | Exceptional 66.1% |
| Immigrants | Asia | 99.6 /100 | #78 | Exceptional 66.1% |
| Turks | 99.6 /100 | #79 | Exceptional 66.1% |
| Malaysians | 99.6 /100 | #80 | Exceptional 66.1% |
| Moroccans | 99.5 /100 | #81 | Exceptional 66.1% |