Hawaiian vs Immigrants from Korea In Labor Force | Age > 16
COMPARE
Hawaiian
Immigrants from Korea
In Labor Force | Age > 16
In Labor Force | Age > 16 Comparison
Hawaiians
Immigrants from Korea
64.7%
IN LABOR FORCE | AGE > 16
9.3/ 100
METRIC RATING
222nd/ 347
METRIC RANK
66.2%
IN LABOR FORCE | AGE > 16
99.7/ 100
METRIC RATING
74th/ 347
METRIC RANK
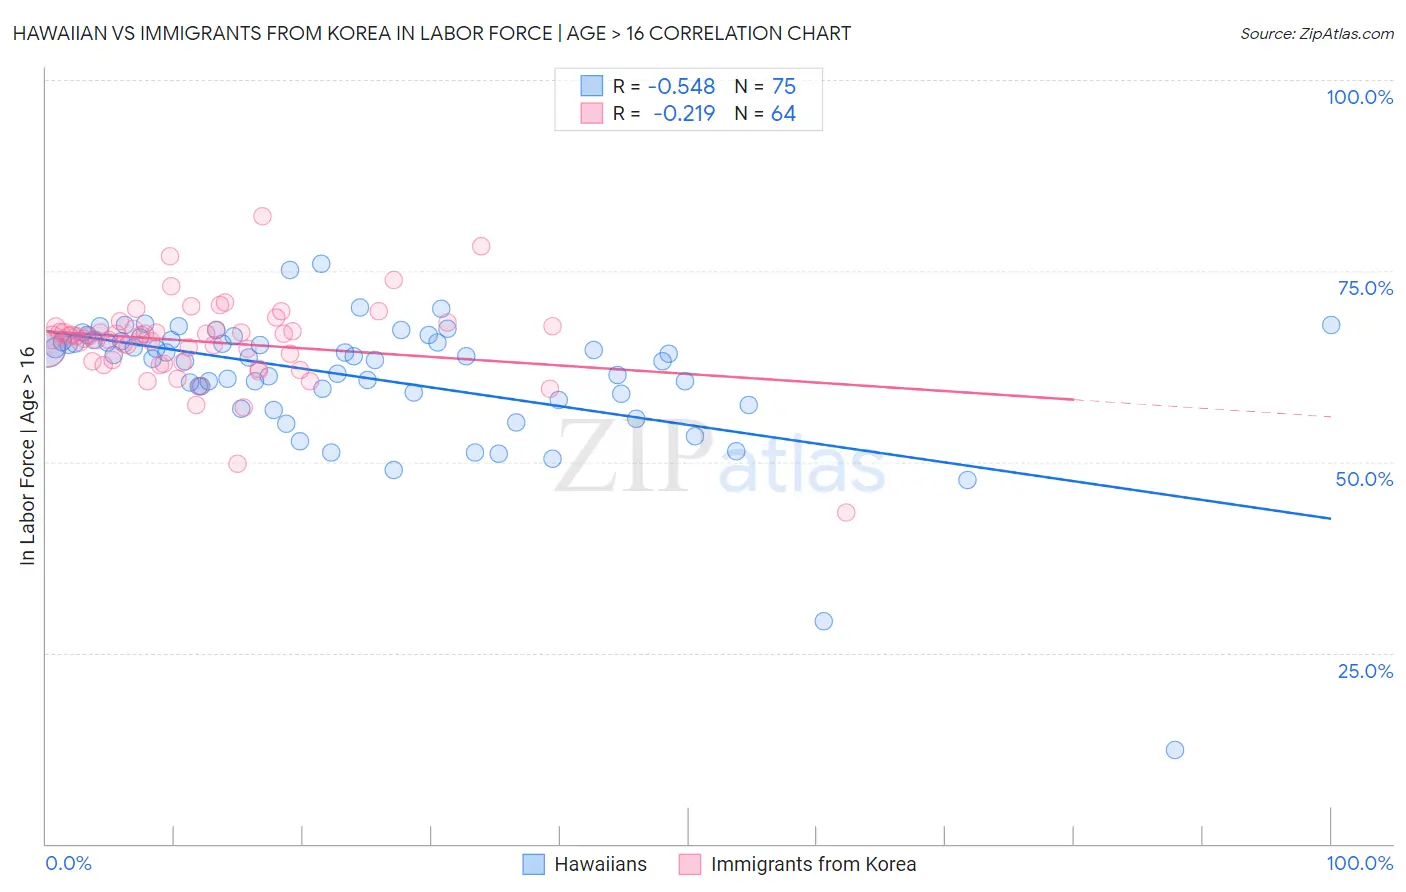
Hawaiian vs Immigrants from Korea In Labor Force | Age > 16 Correlation Chart
The statistical analysis conducted on geographies consisting of 327,602,725 people shows a substantial negative correlation between the proportion of Hawaiians and labor force participation rate among population ages 16 and over in the United States with a correlation coefficient (R) of -0.548 and weighted average of 64.7%. Similarly, the statistical analysis conducted on geographies consisting of 416,355,366 people shows a weak negative correlation between the proportion of Immigrants from Korea and labor force participation rate among population ages 16 and over in the United States with a correlation coefficient (R) of -0.219 and weighted average of 66.2%, a difference of 2.3%.
In Labor Force | Age > 16 Correlation Summary
| Measurement | Hawaiian | Immigrants from Korea |
| Minimum | 12.2% | 43.4% |
| Maximum | 76.0% | 82.1% |
| Range | 63.8% | 38.7% |
| Mean | 61.2% | 65.7% |
| Median | 63.8% | 66.5% |
| Interquartile 25% (IQ1) | 59.0% | 63.1% |
| Interquartile 75% (IQ3) | 65.9% | 67.5% |
| Interquartile Range (IQR) | 6.9% | 4.5% |
| Standard Deviation (Sample) | 9.0% | 5.6% |
| Standard Deviation (Population) | 8.9% | 5.6% |
Similar Demographics by In Labor Force | Age > 16
Demographics Similar to Hawaiians by In Labor Force | Age > 16
In terms of in labor force | age > 16, the demographic groups most similar to Hawaiians are Immigrants from Belize (64.7%, a difference of 0.0%), Immigrants from Micronesia (64.7%, a difference of 0.010%), Alaska Native (64.7%, a difference of 0.020%), Immigrants from Jamaica (64.7%, a difference of 0.020%), and Croatian (64.7%, a difference of 0.020%).
| Demographics | Rating | Rank | In Labor Force | Age > 16 |
| Immigrants | Czechoslovakia | 12.3 /100 | #215 | Poor 64.8% |
| Belgians | 11.4 /100 | #216 | Poor 64.7% |
| U.S. Virgin Islanders | 11.3 /100 | #217 | Poor 64.7% |
| Alsatians | 10.7 /100 | #218 | Poor 64.7% |
| Immigrants | Central America | 10.5 /100 | #219 | Poor 64.7% |
| Alaska Natives | 9.9 /100 | #220 | Tragic 64.7% |
| Immigrants | Micronesia | 9.6 /100 | #221 | Tragic 64.7% |
| Hawaiians | 9.3 /100 | #222 | Tragic 64.7% |
| Immigrants | Belize | 9.2 /100 | #223 | Tragic 64.7% |
| Immigrants | Jamaica | 8.8 /100 | #224 | Tragic 64.7% |
| Croatians | 8.8 /100 | #225 | Tragic 64.7% |
| Europeans | 8.3 /100 | #226 | Tragic 64.7% |
| Poles | 8.3 /100 | #227 | Tragic 64.7% |
| Northern Europeans | 8.2 /100 | #228 | Tragic 64.7% |
| British | 7.3 /100 | #229 | Tragic 64.7% |
Demographics Similar to Immigrants from Korea by In Labor Force | Age > 16
In terms of in labor force | age > 16, the demographic groups most similar to Immigrants from Korea are Immigrants from Vietnam (66.2%, a difference of 0.0%), Burmese (66.2%, a difference of 0.010%), Taiwanese (66.2%, a difference of 0.010%), Immigrants from Singapore (66.2%, a difference of 0.010%), and Asian (66.2%, a difference of 0.030%).
| Demographics | Rating | Rank | In Labor Force | Age > 16 |
| Egyptians | 99.8 /100 | #67 | Exceptional 66.2% |
| Immigrants | Egypt | 99.7 /100 | #68 | Exceptional 66.2% |
| Sub-Saharan Africans | 99.7 /100 | #69 | Exceptional 66.2% |
| Asians | 99.7 /100 | #70 | Exceptional 66.2% |
| Burmese | 99.7 /100 | #71 | Exceptional 66.2% |
| Taiwanese | 99.7 /100 | #72 | Exceptional 66.2% |
| Immigrants | Vietnam | 99.7 /100 | #73 | Exceptional 66.2% |
| Immigrants | Korea | 99.7 /100 | #74 | Exceptional 66.2% |
| Immigrants | Singapore | 99.7 /100 | #75 | Exceptional 66.2% |
| Immigrants | Malaysia | 99.6 /100 | #76 | Exceptional 66.1% |
| Immigrants | Moldova | 99.6 /100 | #77 | Exceptional 66.1% |
| Immigrants | Asia | 99.6 /100 | #78 | Exceptional 66.1% |
| Turks | 99.6 /100 | #79 | Exceptional 66.1% |
| Malaysians | 99.6 /100 | #80 | Exceptional 66.1% |
| Moroccans | 99.5 /100 | #81 | Exceptional 66.1% |