Immigrants from Poland vs Immigrants from Fiji In Labor Force | Age > 16
COMPARE
Immigrants from Poland
Immigrants from Fiji
In Labor Force | Age > 16
In Labor Force | Age > 16 Comparison
Immigrants from Poland
Immigrants from Fiji
65.8%
IN LABOR FORCE | AGE > 16
98.1/ 100
METRIC RATING
107th/ 347
METRIC RANK
65.0%
IN LABOR FORCE | AGE > 16
33.7/ 100
METRIC RATING
192nd/ 347
METRIC RANK
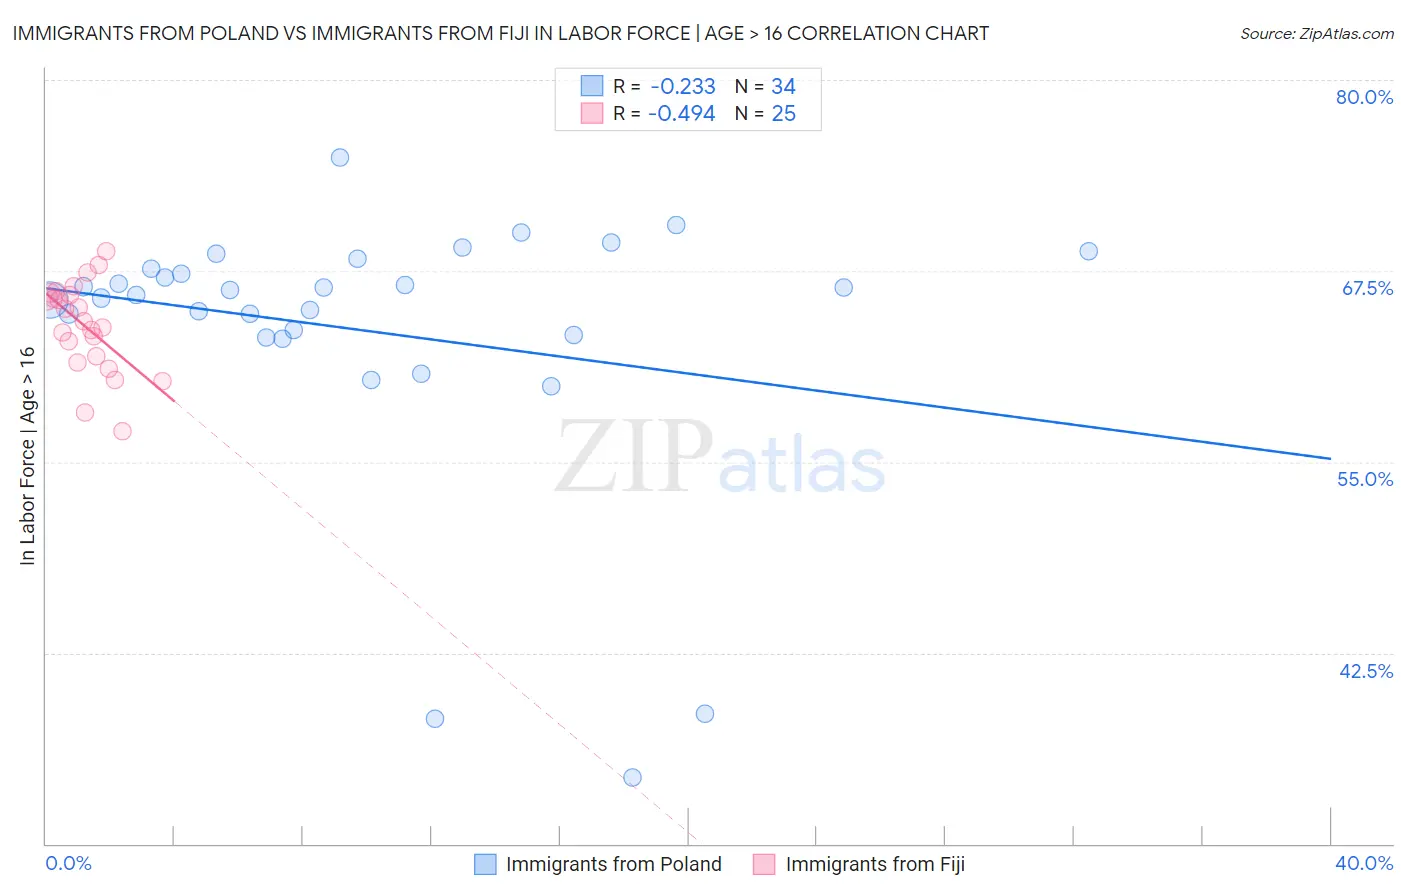
Immigrants from Poland vs Immigrants from Fiji In Labor Force | Age > 16 Correlation Chart
The statistical analysis conducted on geographies consisting of 304,860,925 people shows a weak negative correlation between the proportion of Immigrants from Poland and labor force participation rate among population ages 16 and over in the United States with a correlation coefficient (R) of -0.233 and weighted average of 65.8%. Similarly, the statistical analysis conducted on geographies consisting of 93,756,016 people shows a moderate negative correlation between the proportion of Immigrants from Fiji and labor force participation rate among population ages 16 and over in the United States with a correlation coefficient (R) of -0.494 and weighted average of 65.0%, a difference of 1.3%.
In Labor Force | Age > 16 Correlation Summary
| Measurement | Immigrants from Poland | Immigrants from Fiji |
| Minimum | 34.3% | 57.0% |
| Maximum | 74.9% | 68.8% |
| Range | 40.6% | 11.8% |
| Mean | 63.6% | 63.9% |
| Median | 66.1% | 64.2% |
| Interquartile 25% (IQ1) | 63.3% | 61.7% |
| Interquartile 75% (IQ3) | 67.7% | 66.0% |
| Interquartile Range (IQR) | 4.4% | 4.3% |
| Standard Deviation (Sample) | 8.9% | 3.0% |
| Standard Deviation (Population) | 8.8% | 2.9% |
Similar Demographics by In Labor Force | Age > 16
Demographics Similar to Immigrants from Poland by In Labor Force | Age > 16
In terms of in labor force | age > 16, the demographic groups most similar to Immigrants from Poland are Immigrants from Serbia (65.8%, a difference of 0.0%), Immigrants from Spain (65.8%, a difference of 0.010%), Immigrants from Japan (65.8%, a difference of 0.020%), Colombian (65.9%, a difference of 0.040%), and Palestinian (65.9%, a difference of 0.050%).
| Demographics | Rating | Rank | In Labor Force | Age > 16 |
| Okinawans | 98.7 /100 | #100 | Exceptional 65.9% |
| Immigrants | Colombia | 98.6 /100 | #101 | Exceptional 65.9% |
| Uruguayans | 98.6 /100 | #102 | Exceptional 65.9% |
| Immigrants | South Eastern Asia | 98.5 /100 | #103 | Exceptional 65.9% |
| Palestinians | 98.5 /100 | #104 | Exceptional 65.9% |
| Colombians | 98.4 /100 | #105 | Exceptional 65.9% |
| Immigrants | Serbia | 98.1 /100 | #106 | Exceptional 65.8% |
| Immigrants | Poland | 98.1 /100 | #107 | Exceptional 65.8% |
| Immigrants | Spain | 98.0 /100 | #108 | Exceptional 65.8% |
| Immigrants | Japan | 98.0 /100 | #109 | Exceptional 65.8% |
| Japanese | 97.7 /100 | #110 | Exceptional 65.8% |
| Immigrants | Honduras | 97.5 /100 | #111 | Exceptional 65.8% |
| Laotians | 97.4 /100 | #112 | Exceptional 65.8% |
| Pakistanis | 97.1 /100 | #113 | Exceptional 65.8% |
| Hondurans | 97.1 /100 | #114 | Exceptional 65.8% |
Demographics Similar to Immigrants from Fiji by In Labor Force | Age > 16
In terms of in labor force | age > 16, the demographic groups most similar to Immigrants from Fiji are Barbadian (65.0%, a difference of 0.0%), Scandinavian (65.0%, a difference of 0.0%), Immigrants from Europe (65.0%, a difference of 0.0%), Immigrants from Portugal (65.0%, a difference of 0.010%), and Immigrants from Greece (65.0%, a difference of 0.010%).
| Demographics | Rating | Rank | In Labor Force | Age > 16 |
| Syrians | 40.0 /100 | #185 | Average 65.0% |
| Immigrants | Switzerland | 38.2 /100 | #186 | Fair 65.0% |
| Immigrants | Croatia | 35.7 /100 | #187 | Fair 65.0% |
| Immigrants | Portugal | 34.8 /100 | #188 | Fair 65.0% |
| Immigrants | Greece | 34.3 /100 | #189 | Fair 65.0% |
| Barbadians | 33.9 /100 | #190 | Fair 65.0% |
| Scandinavians | 33.7 /100 | #191 | Fair 65.0% |
| Immigrants | Fiji | 33.7 /100 | #192 | Fair 65.0% |
| Immigrants | Europe | 33.6 /100 | #193 | Fair 65.0% |
| Immigrants | Southern Europe | 31.3 /100 | #194 | Fair 65.0% |
| Romanians | 31.1 /100 | #195 | Fair 65.0% |
| Haitians | 30.6 /100 | #196 | Fair 65.0% |
| Immigrants | Italy | 28.7 /100 | #197 | Fair 65.0% |
| Greeks | 26.1 /100 | #198 | Fair 64.9% |
| Mexican American Indians | 23.1 /100 | #199 | Fair 64.9% |