Immigrants from Micronesia vs Chippewa In Labor Force | Age > 16
COMPARE
Immigrants from Micronesia
Chippewa
In Labor Force | Age > 16
In Labor Force | Age > 16 Comparison
Immigrants from Micronesia
Chippewa
64.7%
IN LABOR FORCE | AGE > 16
9.6/ 100
METRIC RATING
221st/ 347
METRIC RANK
63.1%
IN LABOR FORCE | AGE > 16
0.0/ 100
METRIC RATING
313th/ 347
METRIC RANK
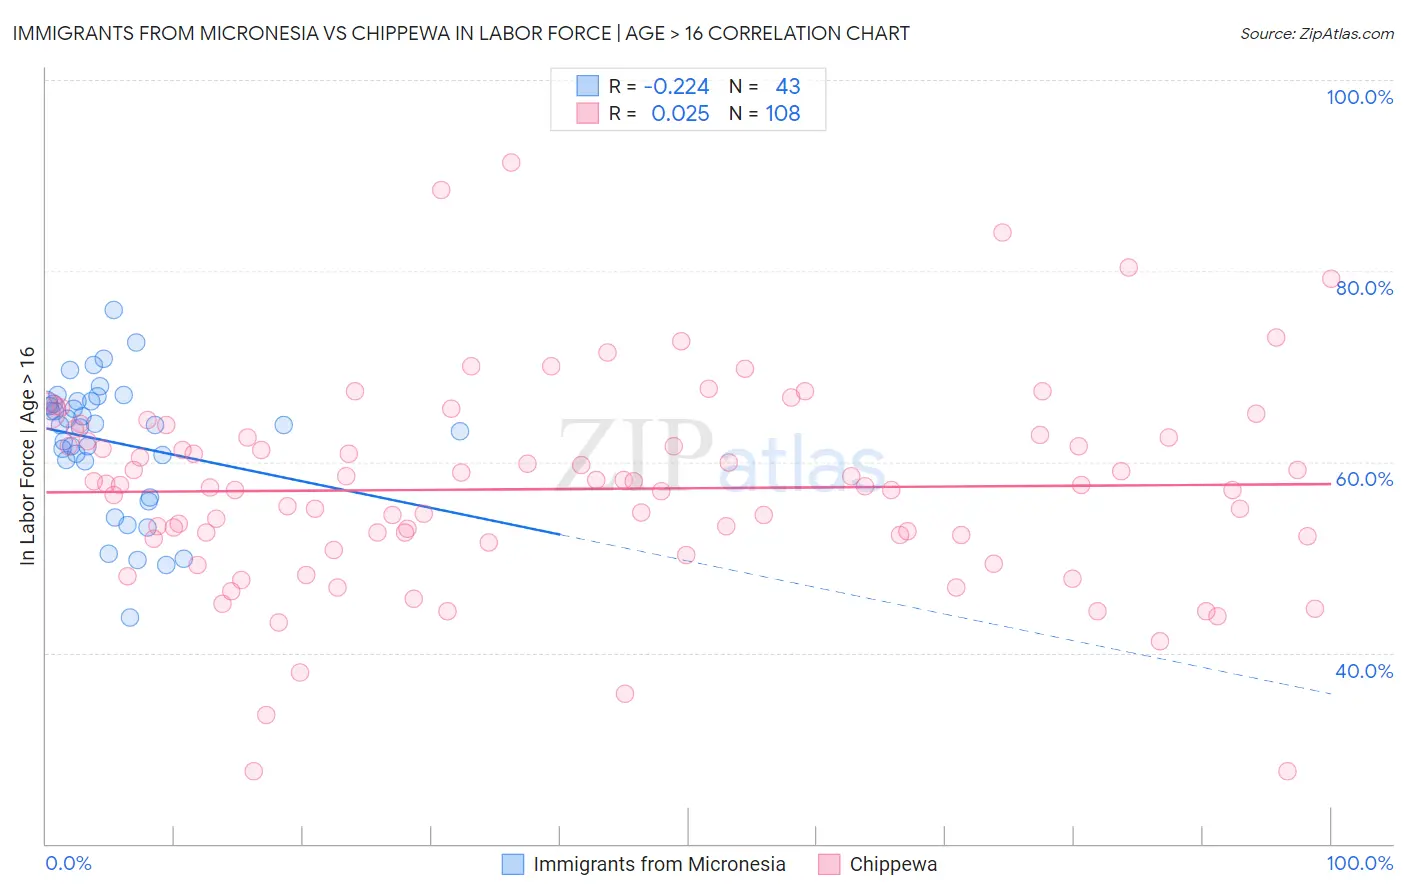
Immigrants from Micronesia vs Chippewa In Labor Force | Age > 16 Correlation Chart
The statistical analysis conducted on geographies consisting of 61,604,386 people shows a weak negative correlation between the proportion of Immigrants from Micronesia and labor force participation rate among population ages 16 and over in the United States with a correlation coefficient (R) of -0.224 and weighted average of 64.7%. Similarly, the statistical analysis conducted on geographies consisting of 215,053,820 people shows no correlation between the proportion of Chippewa and labor force participation rate among population ages 16 and over in the United States with a correlation coefficient (R) of 0.025 and weighted average of 63.1%, a difference of 2.5%.
In Labor Force | Age > 16 Correlation Summary
| Measurement | Immigrants from Micronesia | Chippewa |
| Minimum | 43.8% | 27.6% |
| Maximum | 75.9% | 91.3% |
| Range | 32.1% | 63.7% |
| Mean | 62.1% | 57.2% |
| Median | 63.8% | 57.5% |
| Interquartile 25% (IQ1) | 60.1% | 52.1% |
| Interquartile 75% (IQ3) | 66.3% | 62.5% |
| Interquartile Range (IQR) | 6.2% | 10.4% |
| Standard Deviation (Sample) | 6.9% | 10.7% |
| Standard Deviation (Population) | 6.8% | 10.7% |
Similar Demographics by In Labor Force | Age > 16
Demographics Similar to Immigrants from Micronesia by In Labor Force | Age > 16
In terms of in labor force | age > 16, the demographic groups most similar to Immigrants from Micronesia are Alaska Native (64.7%, a difference of 0.010%), Hawaiian (64.7%, a difference of 0.010%), Immigrants from Belize (64.7%, a difference of 0.010%), Alsatian (64.7%, a difference of 0.030%), and Immigrants from Central America (64.7%, a difference of 0.030%).
| Demographics | Rating | Rank | In Labor Force | Age > 16 |
| Estonians | 13.1 /100 | #214 | Poor 64.8% |
| Immigrants | Czechoslovakia | 12.3 /100 | #215 | Poor 64.8% |
| Belgians | 11.4 /100 | #216 | Poor 64.7% |
| U.S. Virgin Islanders | 11.3 /100 | #217 | Poor 64.7% |
| Alsatians | 10.7 /100 | #218 | Poor 64.7% |
| Immigrants | Central America | 10.5 /100 | #219 | Poor 64.7% |
| Alaska Natives | 9.9 /100 | #220 | Tragic 64.7% |
| Immigrants | Micronesia | 9.6 /100 | #221 | Tragic 64.7% |
| Hawaiians | 9.3 /100 | #222 | Tragic 64.7% |
| Immigrants | Belize | 9.2 /100 | #223 | Tragic 64.7% |
| Immigrants | Jamaica | 8.8 /100 | #224 | Tragic 64.7% |
| Croatians | 8.8 /100 | #225 | Tragic 64.7% |
| Europeans | 8.3 /100 | #226 | Tragic 64.7% |
| Poles | 8.3 /100 | #227 | Tragic 64.7% |
| Northern Europeans | 8.2 /100 | #228 | Tragic 64.7% |
Demographics Similar to Chippewa by In Labor Force | Age > 16
In terms of in labor force | age > 16, the demographic groups most similar to Chippewa are Yaqui (63.0%, a difference of 0.10%), Iroquois (63.2%, a difference of 0.13%), Blackfeet (63.2%, a difference of 0.19%), Shoshone (63.2%, a difference of 0.20%), and Scotch-Irish (63.3%, a difference of 0.27%).
| Demographics | Rating | Rank | In Labor Force | Age > 16 |
| Blacks/African Americans | 0.0 /100 | #306 | Tragic 63.4% |
| Central American Indians | 0.0 /100 | #307 | Tragic 63.4% |
| Pennsylvania Germans | 0.0 /100 | #308 | Tragic 63.4% |
| Scotch-Irish | 0.0 /100 | #309 | Tragic 63.3% |
| Shoshone | 0.0 /100 | #310 | Tragic 63.2% |
| Blackfeet | 0.0 /100 | #311 | Tragic 63.2% |
| Iroquois | 0.0 /100 | #312 | Tragic 63.2% |
| Chippewa | 0.0 /100 | #313 | Tragic 63.1% |
| Yaqui | 0.0 /100 | #314 | Tragic 63.0% |
| Potawatomi | 0.0 /100 | #315 | Tragic 62.8% |
| Yup'ik | 0.0 /100 | #316 | Tragic 62.7% |
| Kiowa | 0.0 /100 | #317 | Tragic 62.4% |
| Chickasaw | 0.0 /100 | #318 | Tragic 62.3% |
| Arapaho | 0.0 /100 | #319 | Tragic 62.1% |
| Yakama | 0.0 /100 | #320 | Tragic 62.1% |