Immigrants from Micronesia vs Immigrants from Turkey In Labor Force | Age > 16
COMPARE
Immigrants from Micronesia
Immigrants from Turkey
In Labor Force | Age > 16
In Labor Force | Age > 16 Comparison
Immigrants from Micronesia
Immigrants from Turkey
64.7%
IN LABOR FORCE | AGE > 16
9.6/ 100
METRIC RATING
221st/ 347
METRIC RANK
66.3%
IN LABOR FORCE | AGE > 16
99.9/ 100
METRIC RATING
59th/ 347
METRIC RANK
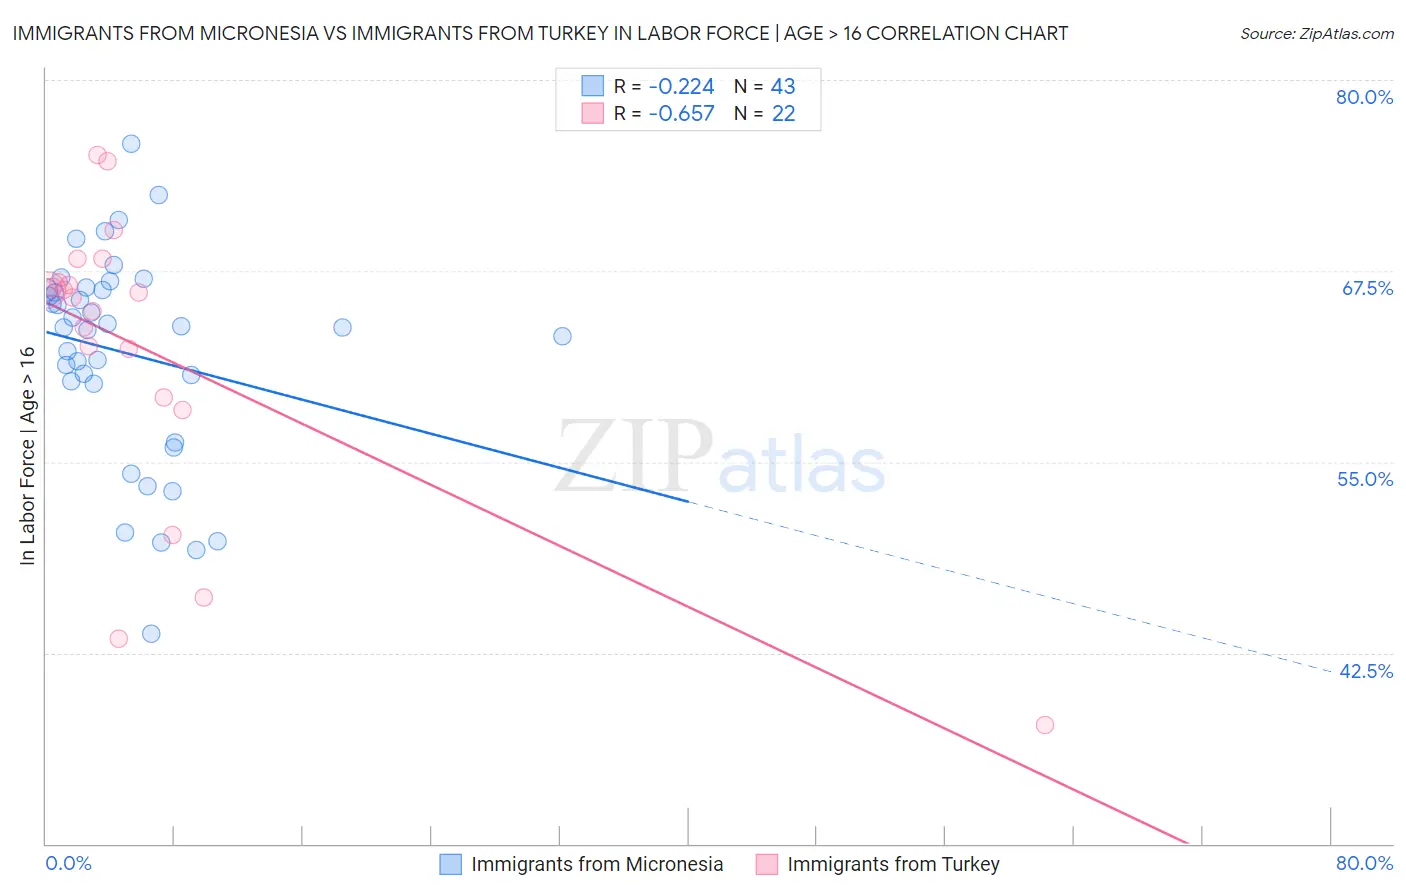
Immigrants from Micronesia vs Immigrants from Turkey In Labor Force | Age > 16 Correlation Chart
The statistical analysis conducted on geographies consisting of 61,604,386 people shows a weak negative correlation between the proportion of Immigrants from Micronesia and labor force participation rate among population ages 16 and over in the United States with a correlation coefficient (R) of -0.224 and weighted average of 64.7%. Similarly, the statistical analysis conducted on geographies consisting of 223,052,786 people shows a significant negative correlation between the proportion of Immigrants from Turkey and labor force participation rate among population ages 16 and over in the United States with a correlation coefficient (R) of -0.657 and weighted average of 66.3%, a difference of 2.5%.
In Labor Force | Age > 16 Correlation Summary
| Measurement | Immigrants from Micronesia | Immigrants from Turkey |
| Minimum | 43.8% | 37.8% |
| Maximum | 75.9% | 75.1% |
| Range | 32.1% | 37.3% |
| Mean | 62.1% | 62.2% |
| Median | 63.8% | 65.9% |
| Interquartile 25% (IQ1) | 60.1% | 59.2% |
| Interquartile 75% (IQ3) | 66.3% | 66.7% |
| Interquartile Range (IQR) | 6.2% | 7.5% |
| Standard Deviation (Sample) | 6.9% | 9.7% |
| Standard Deviation (Population) | 6.8% | 9.5% |
Similar Demographics by In Labor Force | Age > 16
Demographics Similar to Immigrants from Micronesia by In Labor Force | Age > 16
In terms of in labor force | age > 16, the demographic groups most similar to Immigrants from Micronesia are Alaska Native (64.7%, a difference of 0.010%), Hawaiian (64.7%, a difference of 0.010%), Immigrants from Belize (64.7%, a difference of 0.010%), Alsatian (64.7%, a difference of 0.030%), and Immigrants from Central America (64.7%, a difference of 0.030%).
| Demographics | Rating | Rank | In Labor Force | Age > 16 |
| Estonians | 13.1 /100 | #214 | Poor 64.8% |
| Immigrants | Czechoslovakia | 12.3 /100 | #215 | Poor 64.8% |
| Belgians | 11.4 /100 | #216 | Poor 64.7% |
| U.S. Virgin Islanders | 11.3 /100 | #217 | Poor 64.7% |
| Alsatians | 10.7 /100 | #218 | Poor 64.7% |
| Immigrants | Central America | 10.5 /100 | #219 | Poor 64.7% |
| Alaska Natives | 9.9 /100 | #220 | Tragic 64.7% |
| Immigrants | Micronesia | 9.6 /100 | #221 | Tragic 64.7% |
| Hawaiians | 9.3 /100 | #222 | Tragic 64.7% |
| Immigrants | Belize | 9.2 /100 | #223 | Tragic 64.7% |
| Immigrants | Jamaica | 8.8 /100 | #224 | Tragic 64.7% |
| Croatians | 8.8 /100 | #225 | Tragic 64.7% |
| Europeans | 8.3 /100 | #226 | Tragic 64.7% |
| Poles | 8.3 /100 | #227 | Tragic 64.7% |
| Northern Europeans | 8.2 /100 | #228 | Tragic 64.7% |
Demographics Similar to Immigrants from Turkey by In Labor Force | Age > 16
In terms of in labor force | age > 16, the demographic groups most similar to Immigrants from Turkey are Immigrants from Saudi Arabia (66.3%, a difference of 0.020%), Immigrants from Peru (66.3%, a difference of 0.020%), Immigrants from Burma/Myanmar (66.3%, a difference of 0.030%), Indonesian (66.3%, a difference of 0.030%), and Venezuelan (66.3%, a difference of 0.060%).
| Demographics | Rating | Rank | In Labor Force | Age > 16 |
| Paraguayans | 99.9 /100 | #52 | Exceptional 66.5% |
| Immigrants | Sri Lanka | 99.9 /100 | #53 | Exceptional 66.5% |
| Immigrants | Bosnia and Herzegovina | 99.9 /100 | #54 | Exceptional 66.5% |
| Immigrants | Venezuela | 99.9 /100 | #55 | Exceptional 66.4% |
| Immigrants | Senegal | 99.9 /100 | #56 | Exceptional 66.4% |
| Bulgarians | 99.9 /100 | #57 | Exceptional 66.4% |
| Immigrants | Saudi Arabia | 99.9 /100 | #58 | Exceptional 66.3% |
| Immigrants | Turkey | 99.9 /100 | #59 | Exceptional 66.3% |
| Immigrants | Peru | 99.8 /100 | #60 | Exceptional 66.3% |
| Immigrants | Burma/Myanmar | 99.8 /100 | #61 | Exceptional 66.3% |
| Indonesians | 99.8 /100 | #62 | Exceptional 66.3% |
| Venezuelans | 99.8 /100 | #63 | Exceptional 66.3% |
| Peruvians | 99.8 /100 | #64 | Exceptional 66.3% |
| Sri Lankans | 99.8 /100 | #65 | Exceptional 66.3% |
| Jordanians | 99.8 /100 | #66 | Exceptional 66.3% |