Immigrants from Micronesia vs English In Labor Force | Age > 16
COMPARE
Immigrants from Micronesia
English
In Labor Force | Age > 16
In Labor Force | Age > 16 Comparison
Immigrants from Micronesia
English
64.7%
IN LABOR FORCE | AGE > 16
9.6/ 100
METRIC RATING
221st/ 347
METRIC RANK
63.7%
IN LABOR FORCE | AGE > 16
0.1/ 100
METRIC RATING
293rd/ 347
METRIC RANK
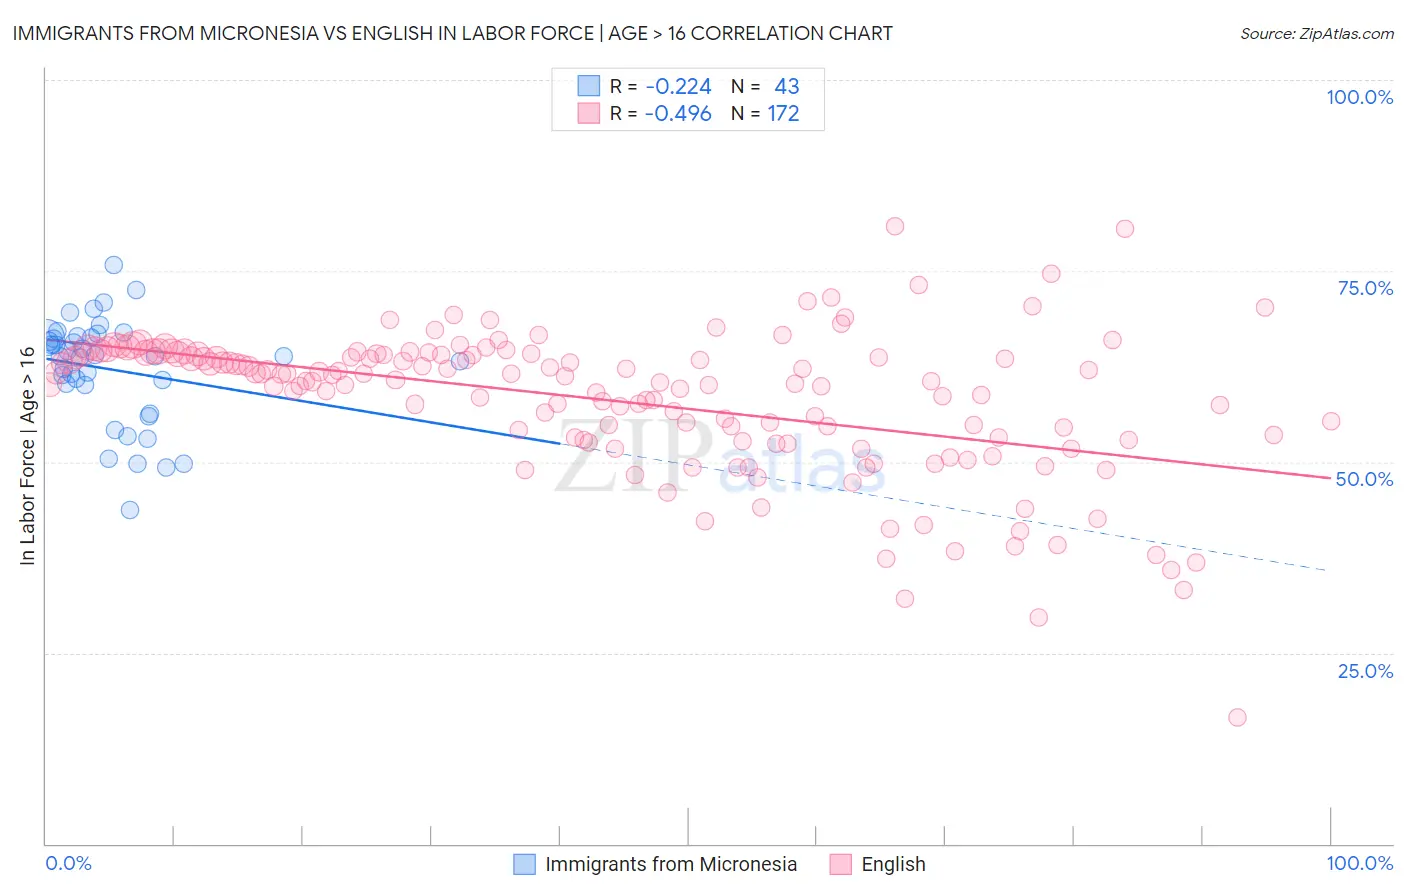
Immigrants from Micronesia vs English In Labor Force | Age > 16 Correlation Chart
The statistical analysis conducted on geographies consisting of 61,604,386 people shows a weak negative correlation between the proportion of Immigrants from Micronesia and labor force participation rate among population ages 16 and over in the United States with a correlation coefficient (R) of -0.224 and weighted average of 64.7%. Similarly, the statistical analysis conducted on geographies consisting of 579,971,917 people shows a moderate negative correlation between the proportion of English and labor force participation rate among population ages 16 and over in the United States with a correlation coefficient (R) of -0.496 and weighted average of 63.7%, a difference of 1.5%.
In Labor Force | Age > 16 Correlation Summary
| Measurement | Immigrants from Micronesia | English |
| Minimum | 43.8% | 16.6% |
| Maximum | 75.9% | 80.8% |
| Range | 32.1% | 64.2% |
| Mean | 62.1% | 58.1% |
| Median | 63.8% | 61.0% |
| Interquartile 25% (IQ1) | 60.1% | 53.1% |
| Interquartile 75% (IQ3) | 66.3% | 64.1% |
| Interquartile Range (IQR) | 6.2% | 11.1% |
| Standard Deviation (Sample) | 6.9% | 9.5% |
| Standard Deviation (Population) | 6.8% | 9.5% |
Similar Demographics by In Labor Force | Age > 16
Demographics Similar to Immigrants from Micronesia by In Labor Force | Age > 16
In terms of in labor force | age > 16, the demographic groups most similar to Immigrants from Micronesia are Alaska Native (64.7%, a difference of 0.010%), Hawaiian (64.7%, a difference of 0.010%), Immigrants from Belize (64.7%, a difference of 0.010%), Alsatian (64.7%, a difference of 0.030%), and Immigrants from Central America (64.7%, a difference of 0.030%).
| Demographics | Rating | Rank | In Labor Force | Age > 16 |
| Estonians | 13.1 /100 | #214 | Poor 64.8% |
| Immigrants | Czechoslovakia | 12.3 /100 | #215 | Poor 64.8% |
| Belgians | 11.4 /100 | #216 | Poor 64.7% |
| U.S. Virgin Islanders | 11.3 /100 | #217 | Poor 64.7% |
| Alsatians | 10.7 /100 | #218 | Poor 64.7% |
| Immigrants | Central America | 10.5 /100 | #219 | Poor 64.7% |
| Alaska Natives | 9.9 /100 | #220 | Tragic 64.7% |
| Immigrants | Micronesia | 9.6 /100 | #221 | Tragic 64.7% |
| Hawaiians | 9.3 /100 | #222 | Tragic 64.7% |
| Immigrants | Belize | 9.2 /100 | #223 | Tragic 64.7% |
| Immigrants | Jamaica | 8.8 /100 | #224 | Tragic 64.7% |
| Croatians | 8.8 /100 | #225 | Tragic 64.7% |
| Europeans | 8.3 /100 | #226 | Tragic 64.7% |
| Poles | 8.3 /100 | #227 | Tragic 64.7% |
| Northern Europeans | 8.2 /100 | #228 | Tragic 64.7% |
Demographics Similar to English by In Labor Force | Age > 16
In terms of in labor force | age > 16, the demographic groups most similar to English are Puget Sound Salish (63.7%, a difference of 0.030%), Spanish American Indian (63.8%, a difference of 0.040%), Immigrants from Canada (63.7%, a difference of 0.080%), Nepalese (63.8%, a difference of 0.10%), and Immigrants from North America (63.7%, a difference of 0.10%).
| Demographics | Rating | Rank | In Labor Force | Age > 16 |
| Immigrants | Austria | 0.1 /100 | #286 | Tragic 63.9% |
| Scottish | 0.1 /100 | #287 | Tragic 63.9% |
| Spanish | 0.1 /100 | #288 | Tragic 63.9% |
| Celtics | 0.1 /100 | #289 | Tragic 63.8% |
| Hungarians | 0.1 /100 | #290 | Tragic 63.8% |
| Nepalese | 0.1 /100 | #291 | Tragic 63.8% |
| Spanish American Indians | 0.1 /100 | #292 | Tragic 63.8% |
| English | 0.1 /100 | #293 | Tragic 63.7% |
| Puget Sound Salish | 0.0 /100 | #294 | Tragic 63.7% |
| Immigrants | Canada | 0.0 /100 | #295 | Tragic 63.7% |
| Immigrants | North America | 0.0 /100 | #296 | Tragic 63.7% |
| Immigrants | Grenada | 0.0 /100 | #297 | Tragic 63.6% |
| Comanche | 0.0 /100 | #298 | Tragic 63.6% |
| Whites/Caucasians | 0.0 /100 | #299 | Tragic 63.6% |
| Immigrants | Azores | 0.0 /100 | #300 | Tragic 63.6% |