Immigrants from Micronesia vs Mexican In Labor Force | Age > 16
COMPARE
Immigrants from Micronesia
Mexican
In Labor Force | Age > 16
In Labor Force | Age > 16 Comparison
Immigrants from Micronesia
Mexicans
64.7%
IN LABOR FORCE | AGE > 16
9.6/ 100
METRIC RATING
221st/ 347
METRIC RANK
64.1%
IN LABOR FORCE | AGE > 16
0.3/ 100
METRIC RATING
275th/ 347
METRIC RANK
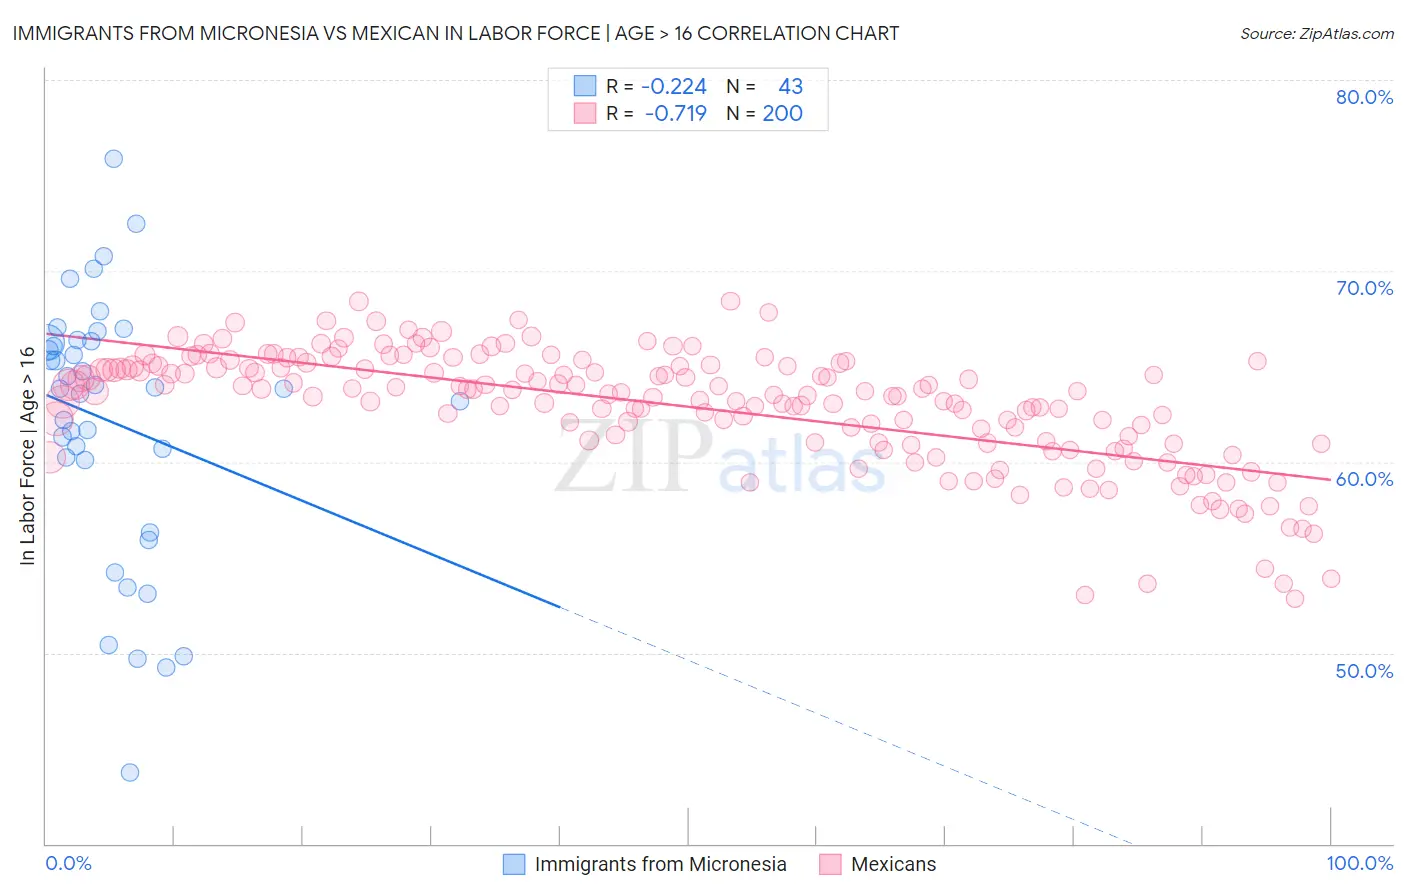
Immigrants from Micronesia vs Mexican In Labor Force | Age > 16 Correlation Chart
The statistical analysis conducted on geographies consisting of 61,604,386 people shows a weak negative correlation between the proportion of Immigrants from Micronesia and labor force participation rate among population ages 16 and over in the United States with a correlation coefficient (R) of -0.224 and weighted average of 64.7%. Similarly, the statistical analysis conducted on geographies consisting of 565,326,570 people shows a strong negative correlation between the proportion of Mexicans and labor force participation rate among population ages 16 and over in the United States with a correlation coefficient (R) of -0.719 and weighted average of 64.1%, a difference of 1.0%.
In Labor Force | Age > 16 Correlation Summary
| Measurement | Immigrants from Micronesia | Mexican |
| Minimum | 43.8% | 52.8% |
| Maximum | 75.9% | 68.4% |
| Range | 32.1% | 15.6% |
| Mean | 62.1% | 62.9% |
| Median | 63.8% | 63.7% |
| Interquartile 25% (IQ1) | 60.1% | 61.0% |
| Interquartile 75% (IQ3) | 66.3% | 65.0% |
| Interquartile Range (IQR) | 6.2% | 4.0% |
| Standard Deviation (Sample) | 6.9% | 3.1% |
| Standard Deviation (Population) | 6.8% | 3.1% |
Similar Demographics by In Labor Force | Age > 16
Demographics Similar to Immigrants from Micronesia by In Labor Force | Age > 16
In terms of in labor force | age > 16, the demographic groups most similar to Immigrants from Micronesia are Alaska Native (64.7%, a difference of 0.010%), Hawaiian (64.7%, a difference of 0.010%), Immigrants from Belize (64.7%, a difference of 0.010%), Alsatian (64.7%, a difference of 0.030%), and Immigrants from Central America (64.7%, a difference of 0.030%).
| Demographics | Rating | Rank | In Labor Force | Age > 16 |
| Estonians | 13.1 /100 | #214 | Poor 64.8% |
| Immigrants | Czechoslovakia | 12.3 /100 | #215 | Poor 64.8% |
| Belgians | 11.4 /100 | #216 | Poor 64.7% |
| U.S. Virgin Islanders | 11.3 /100 | #217 | Poor 64.7% |
| Alsatians | 10.7 /100 | #218 | Poor 64.7% |
| Immigrants | Central America | 10.5 /100 | #219 | Poor 64.7% |
| Alaska Natives | 9.9 /100 | #220 | Tragic 64.7% |
| Immigrants | Micronesia | 9.6 /100 | #221 | Tragic 64.7% |
| Hawaiians | 9.3 /100 | #222 | Tragic 64.7% |
| Immigrants | Belize | 9.2 /100 | #223 | Tragic 64.7% |
| Immigrants | Jamaica | 8.8 /100 | #224 | Tragic 64.7% |
| Croatians | 8.8 /100 | #225 | Tragic 64.7% |
| Europeans | 8.3 /100 | #226 | Tragic 64.7% |
| Poles | 8.3 /100 | #227 | Tragic 64.7% |
| Northern Europeans | 8.2 /100 | #228 | Tragic 64.7% |
Demographics Similar to Mexicans by In Labor Force | Age > 16
In terms of in labor force | age > 16, the demographic groups most similar to Mexicans are Immigrants from Cuba (64.1%, a difference of 0.0%), French American Indian (64.1%, a difference of 0.0%), Native Hawaiian (64.1%, a difference of 0.020%), Hmong (64.1%, a difference of 0.020%), and Immigrants from Bahamas (64.0%, a difference of 0.030%).
| Demographics | Rating | Rank | In Labor Force | Age > 16 |
| Spaniards | 0.5 /100 | #268 | Tragic 64.1% |
| Irish | 0.4 /100 | #269 | Tragic 64.1% |
| Guyanese | 0.4 /100 | #270 | Tragic 64.1% |
| Dominicans | 0.4 /100 | #271 | Tragic 64.1% |
| Native Hawaiians | 0.3 /100 | #272 | Tragic 64.1% |
| Hmong | 0.3 /100 | #273 | Tragic 64.1% |
| Immigrants | Cuba | 0.3 /100 | #274 | Tragic 64.1% |
| Mexicans | 0.3 /100 | #275 | Tragic 64.1% |
| French American Indians | 0.3 /100 | #276 | Tragic 64.1% |
| Immigrants | Bahamas | 0.3 /100 | #277 | Tragic 64.0% |
| Assyrians/Chaldeans/Syriacs | 0.3 /100 | #278 | Tragic 64.0% |
| Welsh | 0.2 /100 | #279 | Tragic 64.0% |
| Immigrants | St. Vincent and the Grenadines | 0.2 /100 | #280 | Tragic 64.0% |
| French Canadians | 0.2 /100 | #281 | Tragic 64.0% |
| Immigrants | Guyana | 0.2 /100 | #282 | Tragic 64.0% |