Immigrants from Portugal vs Chippewa In Labor Force | Age > 16
COMPARE
Immigrants from Portugal
Chippewa
In Labor Force | Age > 16
In Labor Force | Age > 16 Comparison
Immigrants from Portugal
Chippewa
65.0%
IN LABOR FORCE | AGE > 16
34.8/ 100
METRIC RATING
188th/ 347
METRIC RANK
63.1%
IN LABOR FORCE | AGE > 16
0.0/ 100
METRIC RATING
313th/ 347
METRIC RANK
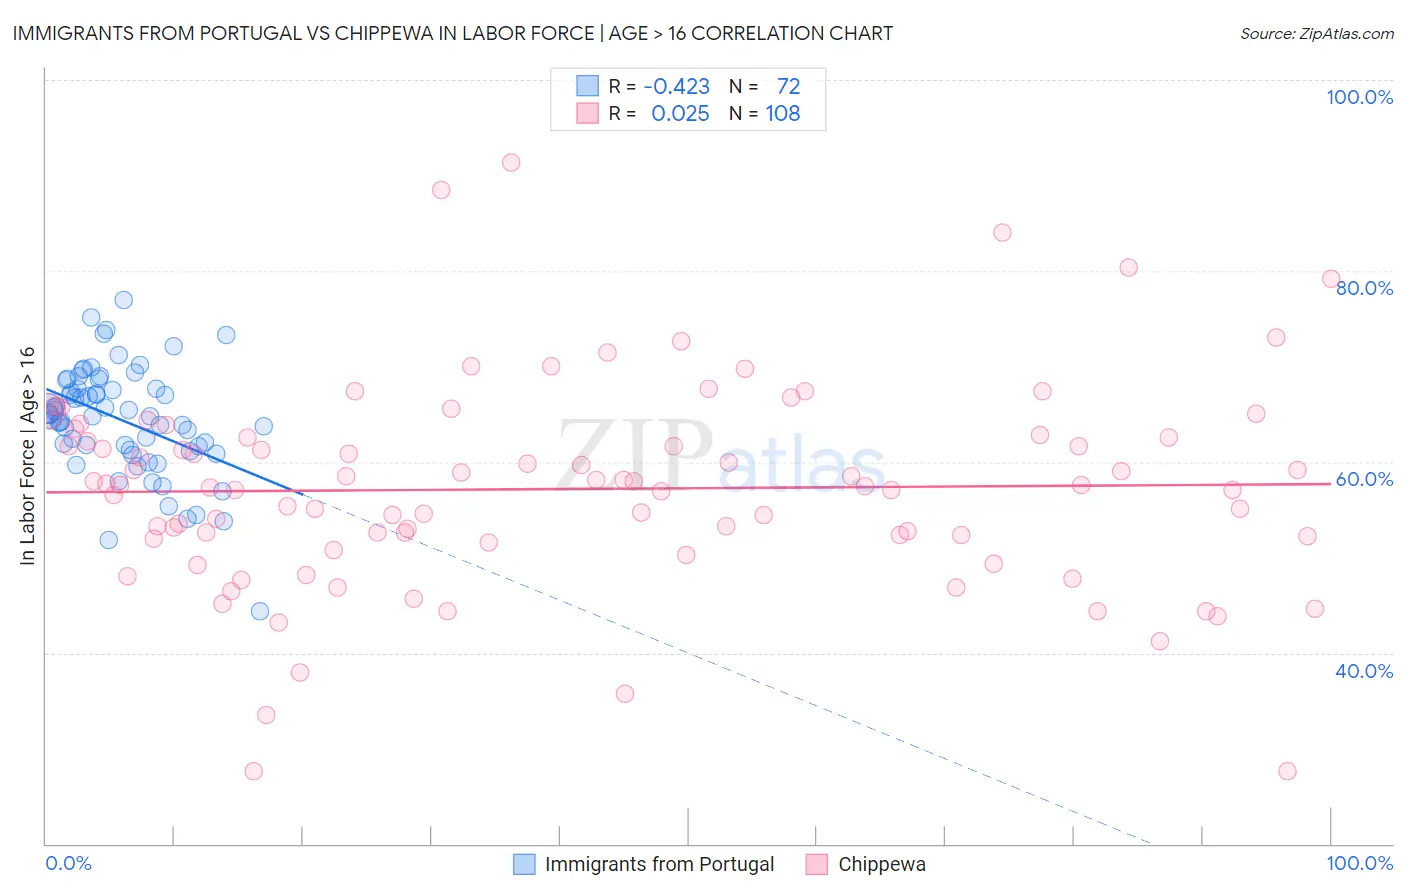
Immigrants from Portugal vs Chippewa In Labor Force | Age > 16 Correlation Chart
The statistical analysis conducted on geographies consisting of 174,779,205 people shows a moderate negative correlation between the proportion of Immigrants from Portugal and labor force participation rate among population ages 16 and over in the United States with a correlation coefficient (R) of -0.423 and weighted average of 65.0%. Similarly, the statistical analysis conducted on geographies consisting of 215,053,820 people shows no correlation between the proportion of Chippewa and labor force participation rate among population ages 16 and over in the United States with a correlation coefficient (R) of 0.025 and weighted average of 63.1%, a difference of 3.0%.
In Labor Force | Age > 16 Correlation Summary
| Measurement | Immigrants from Portugal | Chippewa |
| Minimum | 44.4% | 27.6% |
| Maximum | 76.9% | 91.3% |
| Range | 32.5% | 63.7% |
| Mean | 64.4% | 57.2% |
| Median | 64.9% | 57.5% |
| Interquartile 25% (IQ1) | 61.5% | 52.1% |
| Interquartile 75% (IQ3) | 67.6% | 62.5% |
| Interquartile Range (IQR) | 6.2% | 10.4% |
| Standard Deviation (Sample) | 5.7% | 10.7% |
| Standard Deviation (Population) | 5.6% | 10.7% |
Similar Demographics by In Labor Force | Age > 16
Demographics Similar to Immigrants from Portugal by In Labor Force | Age > 16
In terms of in labor force | age > 16, the demographic groups most similar to Immigrants from Portugal are Immigrants from Croatia (65.0%, a difference of 0.010%), Immigrants from Greece (65.0%, a difference of 0.010%), Barbadian (65.0%, a difference of 0.010%), Scandinavian (65.0%, a difference of 0.010%), and Immigrants from Fiji (65.0%, a difference of 0.010%).
| Demographics | Rating | Rank | In Labor Force | Age > 16 |
| Immigrants | Panama | 42.4 /100 | #181 | Average 65.1% |
| Immigrants | Nicaragua | 41.1 /100 | #182 | Average 65.1% |
| Soviet Union | 40.5 /100 | #183 | Average 65.0% |
| Carpatho Rusyns | 40.0 /100 | #184 | Average 65.0% |
| Syrians | 40.0 /100 | #185 | Average 65.0% |
| Immigrants | Switzerland | 38.2 /100 | #186 | Fair 65.0% |
| Immigrants | Croatia | 35.7 /100 | #187 | Fair 65.0% |
| Immigrants | Portugal | 34.8 /100 | #188 | Fair 65.0% |
| Immigrants | Greece | 34.3 /100 | #189 | Fair 65.0% |
| Barbadians | 33.9 /100 | #190 | Fair 65.0% |
| Scandinavians | 33.7 /100 | #191 | Fair 65.0% |
| Immigrants | Fiji | 33.7 /100 | #192 | Fair 65.0% |
| Immigrants | Europe | 33.6 /100 | #193 | Fair 65.0% |
| Immigrants | Southern Europe | 31.3 /100 | #194 | Fair 65.0% |
| Romanians | 31.1 /100 | #195 | Fair 65.0% |
Demographics Similar to Chippewa by In Labor Force | Age > 16
In terms of in labor force | age > 16, the demographic groups most similar to Chippewa are Yaqui (63.0%, a difference of 0.10%), Iroquois (63.2%, a difference of 0.13%), Blackfeet (63.2%, a difference of 0.19%), Shoshone (63.2%, a difference of 0.20%), and Scotch-Irish (63.3%, a difference of 0.27%).
| Demographics | Rating | Rank | In Labor Force | Age > 16 |
| Blacks/African Americans | 0.0 /100 | #306 | Tragic 63.4% |
| Central American Indians | 0.0 /100 | #307 | Tragic 63.4% |
| Pennsylvania Germans | 0.0 /100 | #308 | Tragic 63.4% |
| Scotch-Irish | 0.0 /100 | #309 | Tragic 63.3% |
| Shoshone | 0.0 /100 | #310 | Tragic 63.2% |
| Blackfeet | 0.0 /100 | #311 | Tragic 63.2% |
| Iroquois | 0.0 /100 | #312 | Tragic 63.2% |
| Chippewa | 0.0 /100 | #313 | Tragic 63.1% |
| Yaqui | 0.0 /100 | #314 | Tragic 63.0% |
| Potawatomi | 0.0 /100 | #315 | Tragic 62.8% |
| Yup'ik | 0.0 /100 | #316 | Tragic 62.7% |
| Kiowa | 0.0 /100 | #317 | Tragic 62.4% |
| Chickasaw | 0.0 /100 | #318 | Tragic 62.3% |
| Arapaho | 0.0 /100 | #319 | Tragic 62.1% |
| Yakama | 0.0 /100 | #320 | Tragic 62.1% |