Immigrants from Iraq vs Ukrainian In Labor Force | Age 45-54
COMPARE
Immigrants from Iraq
Ukrainian
In Labor Force | Age 45-54
In Labor Force | Age 45-54 Comparison
Immigrants from Iraq
Ukrainians
82.5%
IN LABOR FORCE | AGE 45-54
20.9/ 100
METRIC RATING
192nd/ 347
METRIC RANK
83.2%
IN LABOR FORCE | AGE 45-54
92.7/ 100
METRIC RATING
109th/ 347
METRIC RANK
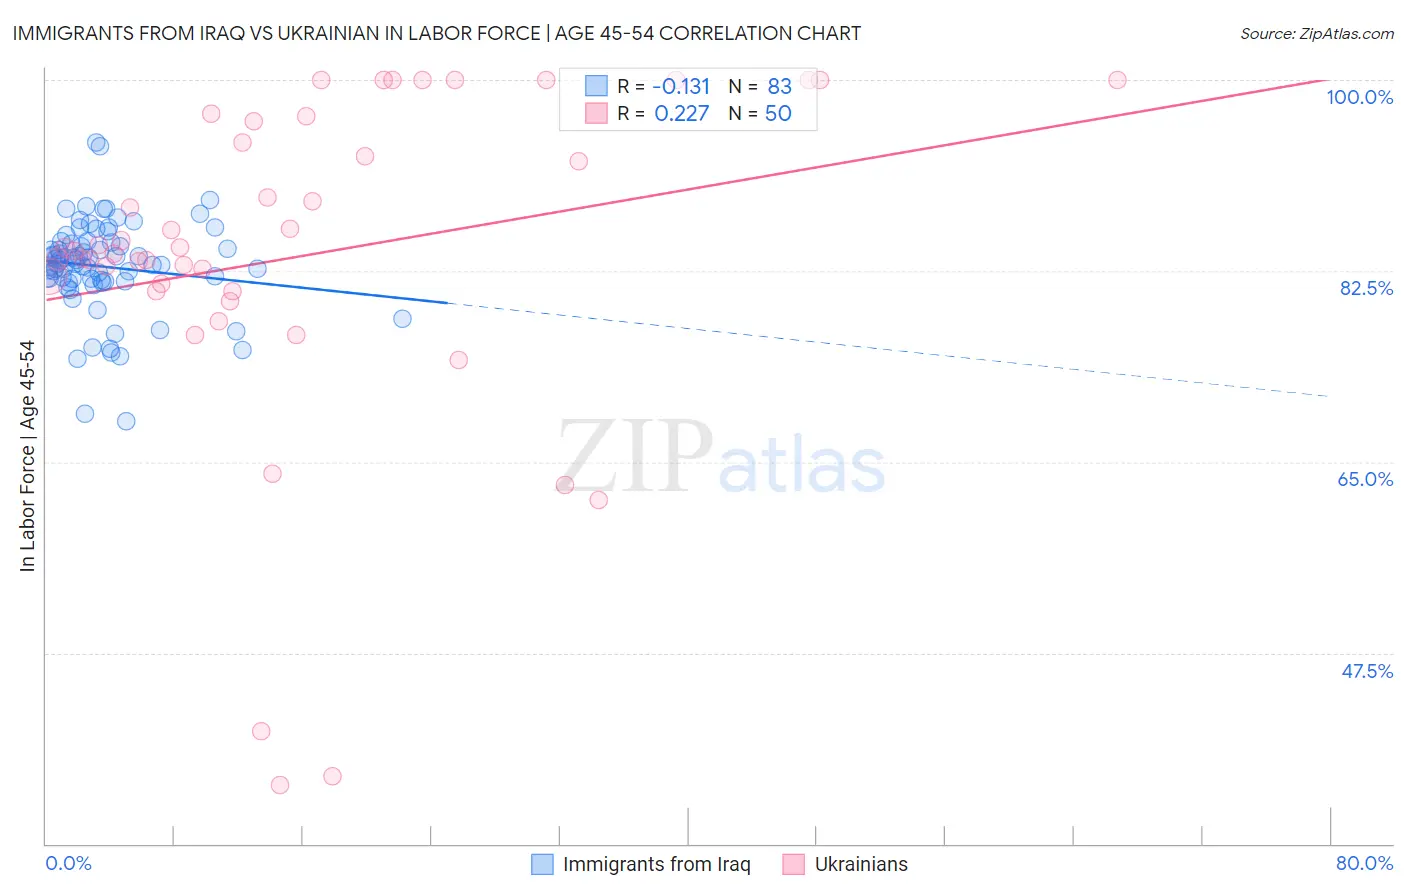
Immigrants from Iraq vs Ukrainian In Labor Force | Age 45-54 Correlation Chart
The statistical analysis conducted on geographies consisting of 194,753,742 people shows a poor negative correlation between the proportion of Immigrants from Iraq and labor force participation rate among population between the ages 45 and 54 in the United States with a correlation coefficient (R) of -0.131 and weighted average of 82.5%. Similarly, the statistical analysis conducted on geographies consisting of 448,292,186 people shows a weak positive correlation between the proportion of Ukrainians and labor force participation rate among population between the ages 45 and 54 in the United States with a correlation coefficient (R) of 0.227 and weighted average of 83.2%, a difference of 0.85%.
In Labor Force | Age 45-54 Correlation Summary
| Measurement | Immigrants from Iraq | Ukrainian |
| Minimum | 68.7% | 35.3% |
| Maximum | 94.3% | 100.0% |
| Range | 25.6% | 64.7% |
| Mean | 82.9% | 83.9% |
| Median | 83.2% | 84.5% |
| Interquartile 25% (IQ1) | 81.6% | 80.7% |
| Interquartile 75% (IQ3) | 85.1% | 96.2% |
| Interquartile Range (IQR) | 3.5% | 15.5% |
| Standard Deviation (Sample) | 4.3% | 15.4% |
| Standard Deviation (Population) | 4.3% | 15.2% |
Similar Demographics by In Labor Force | Age 45-54
Demographics Similar to Immigrants from Iraq by In Labor Force | Age 45-54
In terms of in labor force | age 45-54, the demographic groups most similar to Immigrants from Iraq are Australian (82.5%, a difference of 0.0%), Immigrants from Norway (82.5%, a difference of 0.0%), Immigrants from Canada (82.5%, a difference of 0.010%), Armenian (82.5%, a difference of 0.030%), and Immigrants from North America (82.5%, a difference of 0.030%).
| Demographics | Rating | Rank | In Labor Force | Age 45-54 |
| Immigrants | England | 32.2 /100 | #185 | Fair 82.6% |
| Irish | 29.2 /100 | #186 | Fair 82.6% |
| Immigrants | Costa Rica | 28.3 /100 | #187 | Fair 82.6% |
| South Africans | 28.0 /100 | #188 | Fair 82.6% |
| Syrians | 26.0 /100 | #189 | Fair 82.6% |
| British | 25.7 /100 | #190 | Fair 82.6% |
| Armenians | 23.2 /100 | #191 | Fair 82.5% |
| Immigrants | Iraq | 20.9 /100 | #192 | Fair 82.5% |
| Australians | 20.8 /100 | #193 | Fair 82.5% |
| Immigrants | Norway | 20.7 /100 | #194 | Fair 82.5% |
| Immigrants | Canada | 20.0 /100 | #195 | Fair 82.5% |
| Immigrants | North America | 18.8 /100 | #196 | Poor 82.5% |
| Lebanese | 18.2 /100 | #197 | Poor 82.5% |
| Immigrants | Denmark | 17.9 /100 | #198 | Poor 82.5% |
| Moroccans | 15.7 /100 | #199 | Poor 82.5% |
Demographics Similar to Ukrainians by In Labor Force | Age 45-54
In terms of in labor force | age 45-54, the demographic groups most similar to Ukrainians are Slovak (83.2%, a difference of 0.0%), Immigrants from Africa (83.2%, a difference of 0.0%), Iranian (83.2%, a difference of 0.010%), Immigrants from Italy (83.2%, a difference of 0.010%), and Immigrants from Afghanistan (83.2%, a difference of 0.010%).
| Demographics | Rating | Rank | In Labor Force | Age 45-54 |
| Immigrants | Singapore | 93.9 /100 | #102 | Exceptional 83.3% |
| Albanians | 93.9 /100 | #103 | Exceptional 83.3% |
| Immigrants | Romania | 93.8 /100 | #104 | Exceptional 83.3% |
| Immigrants | South America | 93.5 /100 | #105 | Exceptional 83.2% |
| Sri Lankans | 93.2 /100 | #106 | Exceptional 83.2% |
| Iranians | 92.9 /100 | #107 | Exceptional 83.2% |
| Slovaks | 92.8 /100 | #108 | Exceptional 83.2% |
| Ukrainians | 92.7 /100 | #109 | Exceptional 83.2% |
| Immigrants | Africa | 92.6 /100 | #110 | Exceptional 83.2% |
| Immigrants | Italy | 92.5 /100 | #111 | Exceptional 83.2% |
| Immigrants | Afghanistan | 92.4 /100 | #112 | Exceptional 83.2% |
| Immigrants | Albania | 91.8 /100 | #113 | Exceptional 83.2% |
| Assyrians/Chaldeans/Syriacs | 91.7 /100 | #114 | Exceptional 83.2% |
| Immigrants | Chile | 91.6 /100 | #115 | Exceptional 83.2% |
| Immigrants | Malaysia | 91.4 /100 | #116 | Exceptional 83.2% |