Immigrants from Iraq vs Immigrants from Hungary In Labor Force | Age 45-54
COMPARE
Immigrants from Iraq
Immigrants from Hungary
In Labor Force | Age 45-54
In Labor Force | Age 45-54 Comparison
Immigrants from Iraq
Immigrants from Hungary
82.5%
IN LABOR FORCE | AGE 45-54
20.9/ 100
METRIC RATING
192nd/ 347
METRIC RANK
82.7%
IN LABOR FORCE | AGE 45-54
37.1/ 100
METRIC RATING
182nd/ 347
METRIC RANK
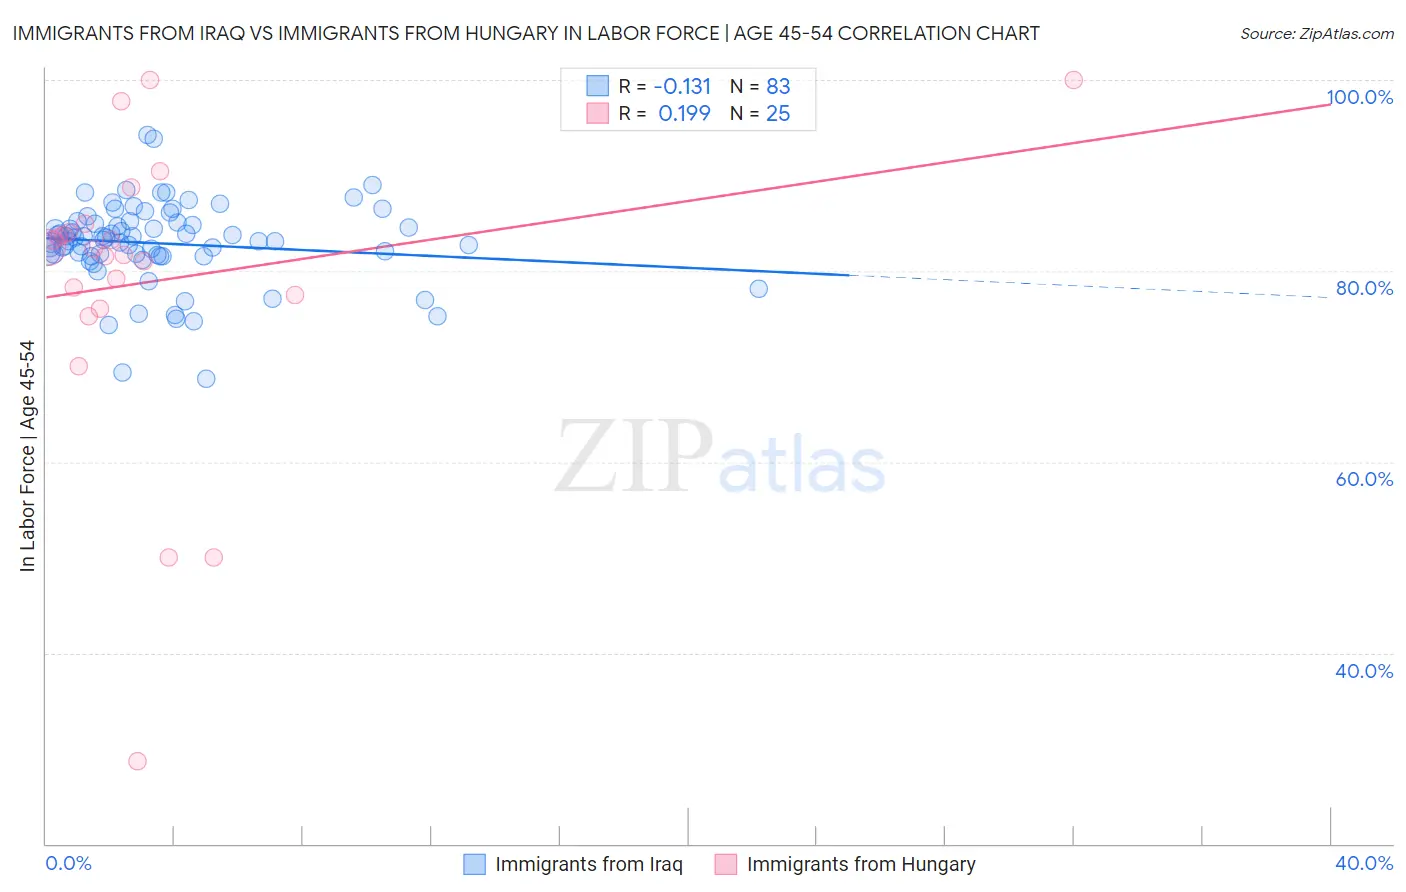
Immigrants from Iraq vs Immigrants from Hungary In Labor Force | Age 45-54 Correlation Chart
The statistical analysis conducted on geographies consisting of 194,753,742 people shows a poor negative correlation between the proportion of Immigrants from Iraq and labor force participation rate among population between the ages 45 and 54 in the United States with a correlation coefficient (R) of -0.131 and weighted average of 82.5%. Similarly, the statistical analysis conducted on geographies consisting of 195,661,497 people shows a poor positive correlation between the proportion of Immigrants from Hungary and labor force participation rate among population between the ages 45 and 54 in the United States with a correlation coefficient (R) of 0.199 and weighted average of 82.7%, a difference of 0.18%.
In Labor Force | Age 45-54 Correlation Summary
| Measurement | Immigrants from Iraq | Immigrants from Hungary |
| Minimum | 68.7% | 28.7% |
| Maximum | 94.3% | 100.0% |
| Range | 25.6% | 71.3% |
| Mean | 82.9% | 78.9% |
| Median | 83.2% | 82.3% |
| Interquartile 25% (IQ1) | 81.6% | 76.7% |
| Interquartile 75% (IQ3) | 85.1% | 84.5% |
| Interquartile Range (IQR) | 3.5% | 7.7% |
| Standard Deviation (Sample) | 4.3% | 15.8% |
| Standard Deviation (Population) | 4.3% | 15.4% |
Demographics Similar to Immigrants from Iraq and Immigrants from Hungary by In Labor Force | Age 45-54
In terms of in labor force | age 45-54, the demographic groups most similar to Immigrants from Iraq are Australian (82.5%, a difference of 0.0%), Immigrants from Norway (82.5%, a difference of 0.0%), Immigrants from Canada (82.5%, a difference of 0.010%), Armenian (82.5%, a difference of 0.030%), and Immigrants from North America (82.5%, a difference of 0.030%). Similarly, the demographic groups most similar to Immigrants from Hungary are Hungarian (82.7%, a difference of 0.010%), Israeli (82.7%, a difference of 0.010%), Immigrants from Switzerland (82.7%, a difference of 0.020%), Nigerian (82.7%, a difference of 0.030%), and New Zealander (82.6%, a difference of 0.040%).
| Demographics | Rating | Rank | In Labor Force | Age 45-54 |
| Immigrants | Nicaragua | 44.6 /100 | #177 | Average 82.7% |
| Nigerians | 40.5 /100 | #178 | Average 82.7% |
| Immigrants | Switzerland | 39.4 /100 | #179 | Fair 82.7% |
| Hungarians | 38.0 /100 | #180 | Fair 82.7% |
| Israelis | 37.7 /100 | #181 | Fair 82.7% |
| Immigrants | Hungary | 37.1 /100 | #182 | Fair 82.7% |
| New Zealanders | 32.7 /100 | #183 | Fair 82.6% |
| Europeans | 32.6 /100 | #184 | Fair 82.6% |
| Immigrants | England | 32.2 /100 | #185 | Fair 82.6% |
| Irish | 29.2 /100 | #186 | Fair 82.6% |
| Immigrants | Costa Rica | 28.3 /100 | #187 | Fair 82.6% |
| South Africans | 28.0 /100 | #188 | Fair 82.6% |
| Syrians | 26.0 /100 | #189 | Fair 82.6% |
| British | 25.7 /100 | #190 | Fair 82.6% |
| Armenians | 23.2 /100 | #191 | Fair 82.5% |
| Immigrants | Iraq | 20.9 /100 | #192 | Fair 82.5% |
| Australians | 20.8 /100 | #193 | Fair 82.5% |
| Immigrants | Norway | 20.7 /100 | #194 | Fair 82.5% |
| Immigrants | Canada | 20.0 /100 | #195 | Fair 82.5% |
| Immigrants | North America | 18.8 /100 | #196 | Poor 82.5% |
| Lebanese | 18.2 /100 | #197 | Poor 82.5% |