Immigrants from Iraq vs Ukrainian Median Household Income
COMPARE
Immigrants from Iraq
Ukrainian
Median Household Income
Median Household Income Comparison
Immigrants from Iraq
Ukrainians
$82,594
MEDIAN HOUSEHOLD INCOME
16.7/ 100
METRIC RATING
209th/ 347
METRIC RANK
$91,456
MEDIAN HOUSEHOLD INCOME
98.3/ 100
METRIC RATING
100th/ 347
METRIC RANK
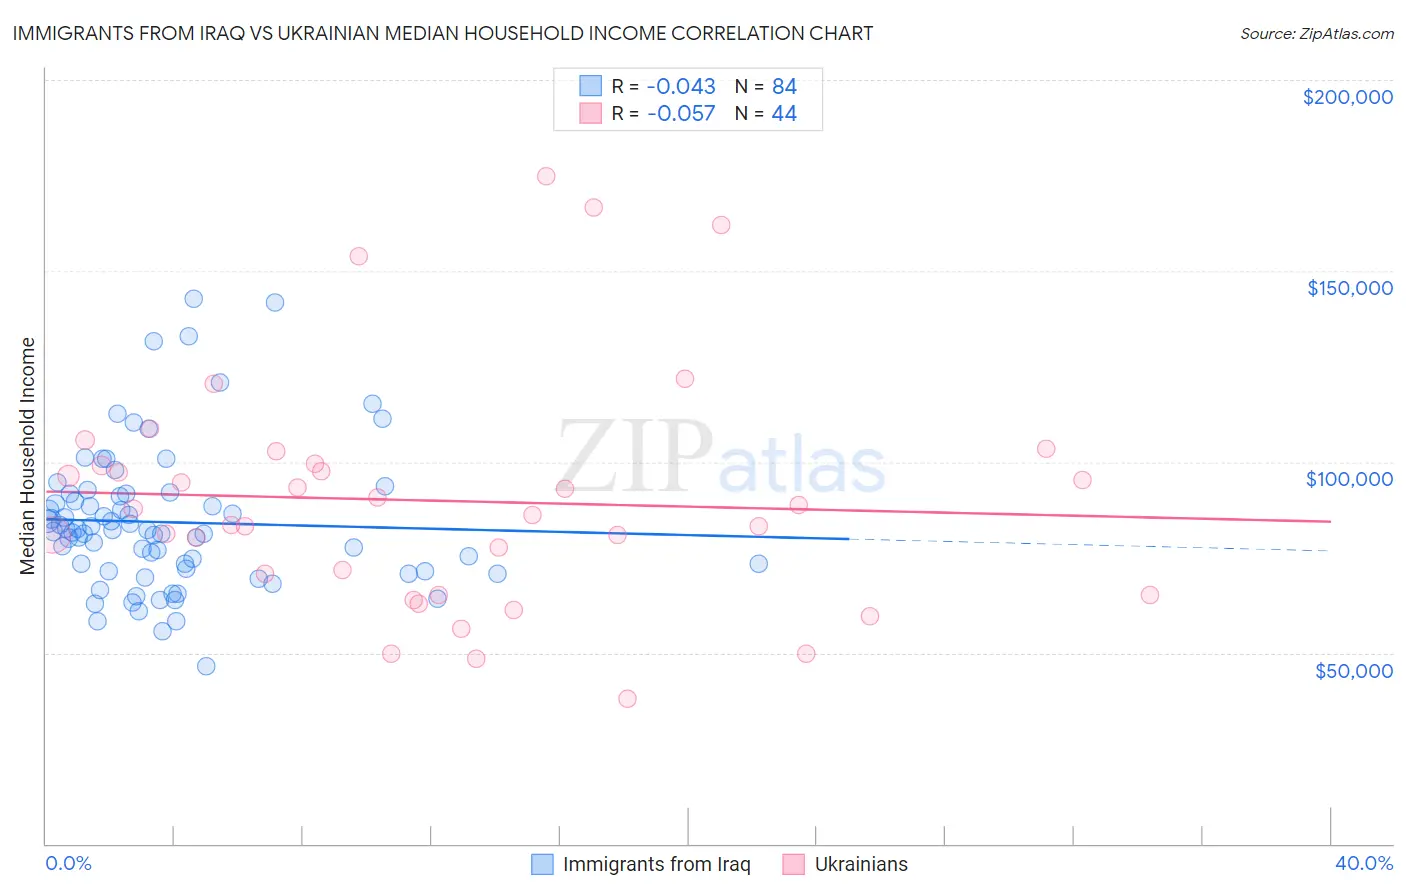
Immigrants from Iraq vs Ukrainian Median Household Income Correlation Chart
The statistical analysis conducted on geographies consisting of 194,736,423 people shows no correlation between the proportion of Immigrants from Iraq and median household income in the United States with a correlation coefficient (R) of -0.043 and weighted average of $82,594. Similarly, the statistical analysis conducted on geographies consisting of 448,198,646 people shows a slight negative correlation between the proportion of Ukrainians and median household income in the United States with a correlation coefficient (R) of -0.057 and weighted average of $91,456, a difference of 10.7%.
Median Household Income Correlation Summary
| Measurement | Immigrants from Iraq | Ukrainian |
| Minimum | $46,565 | $37,811 |
| Maximum | $142,768 | $174,670 |
| Range | $96,203 | $136,859 |
| Mean | $84,180 | $89,793 |
| Median | $81,932 | $86,791 |
| Interquartile 25% (IQ1) | $71,691 | $67,812 |
| Interquartile 75% (IQ3) | $91,376 | $99,299 |
| Interquartile Range (IQR) | $19,685 | $31,486 |
| Standard Deviation (Sample) | $18,542 | $30,572 |
| Standard Deviation (Population) | $18,431 | $30,223 |
Similar Demographics by Median Household Income
Demographics Similar to Immigrants from Iraq by Median Household Income
In terms of median household income, the demographic groups most similar to Immigrants from Iraq are Immigrants from Uruguay ($82,560, a difference of 0.040%), Salvadoran ($82,449, a difference of 0.18%), Venezuelan ($82,432, a difference of 0.20%), Nepalese ($82,410, a difference of 0.22%), and French Canadian ($82,810, a difference of 0.26%).
| Demographics | Rating | Rank | Median Household Income |
| Immigrants | Thailand | 24.3 /100 | #202 | Fair $83,327 |
| Immigrants | Cambodia | 24.0 /100 | #203 | Fair $83,304 |
| Immigrants | Africa | 23.8 /100 | #204 | Fair $83,289 |
| Celtics | 22.7 /100 | #205 | Fair $83,193 |
| Immigrants | Kenya | 21.3 /100 | #206 | Fair $83,068 |
| Dutch | 20.3 /100 | #207 | Fair $82,971 |
| French Canadians | 18.7 /100 | #208 | Poor $82,810 |
| Immigrants | Iraq | 16.7 /100 | #209 | Poor $82,594 |
| Immigrants | Uruguay | 16.4 /100 | #210 | Poor $82,560 |
| Salvadorans | 15.4 /100 | #211 | Poor $82,449 |
| Venezuelans | 15.3 /100 | #212 | Poor $82,432 |
| Nepalese | 15.1 /100 | #213 | Poor $82,410 |
| Panamanians | 14.0 /100 | #214 | Poor $82,272 |
| Vietnamese | 13.8 /100 | #215 | Poor $82,248 |
| Yugoslavians | 13.3 /100 | #216 | Poor $82,186 |
Demographics Similar to Ukrainians by Median Household Income
In terms of median household income, the demographic groups most similar to Ukrainians are Immigrants from Moldova ($91,446, a difference of 0.010%), Immigrants from South Eastern Asia ($91,541, a difference of 0.090%), Austrian ($91,339, a difference of 0.13%), Immigrants from Southern Europe ($91,605, a difference of 0.16%), and Immigrants from Serbia ($91,730, a difference of 0.30%).
| Demographics | Rating | Rank | Median Household Income |
| Immigrants | Lebanon | 98.7 /100 | #93 | Exceptional $91,887 |
| Immigrants | North America | 98.7 /100 | #94 | Exceptional $91,860 |
| Armenians | 98.7 /100 | #95 | Exceptional $91,807 |
| Jordanians | 98.7 /100 | #96 | Exceptional $91,794 |
| Immigrants | Serbia | 98.6 /100 | #97 | Exceptional $91,730 |
| Immigrants | Southern Europe | 98.5 /100 | #98 | Exceptional $91,605 |
| Immigrants | South Eastern Asia | 98.4 /100 | #99 | Exceptional $91,541 |
| Ukrainians | 98.3 /100 | #100 | Exceptional $91,456 |
| Immigrants | Moldova | 98.3 /100 | #101 | Exceptional $91,446 |
| Austrians | 98.2 /100 | #102 | Exceptional $91,339 |
| Immigrants | Ukraine | 98.0 /100 | #103 | Exceptional $91,124 |
| Immigrants | Kazakhstan | 97.8 /100 | #104 | Exceptional $91,015 |
| Immigrants | Brazil | 97.7 /100 | #105 | Exceptional $90,907 |
| Macedonians | 97.4 /100 | #106 | Exceptional $90,761 |
| Croatians | 97.3 /100 | #107 | Exceptional $90,685 |