Immigrants from Iraq vs Chinese In Labor Force | Age 45-54
COMPARE
Immigrants from Iraq
Chinese
In Labor Force | Age 45-54
In Labor Force | Age 45-54 Comparison
Immigrants from Iraq
Chinese
82.5%
IN LABOR FORCE | AGE 45-54
20.9/ 100
METRIC RATING
192nd/ 347
METRIC RANK
84.1%
IN LABOR FORCE | AGE 45-54
99.9/ 100
METRIC RATING
13th/ 347
METRIC RANK
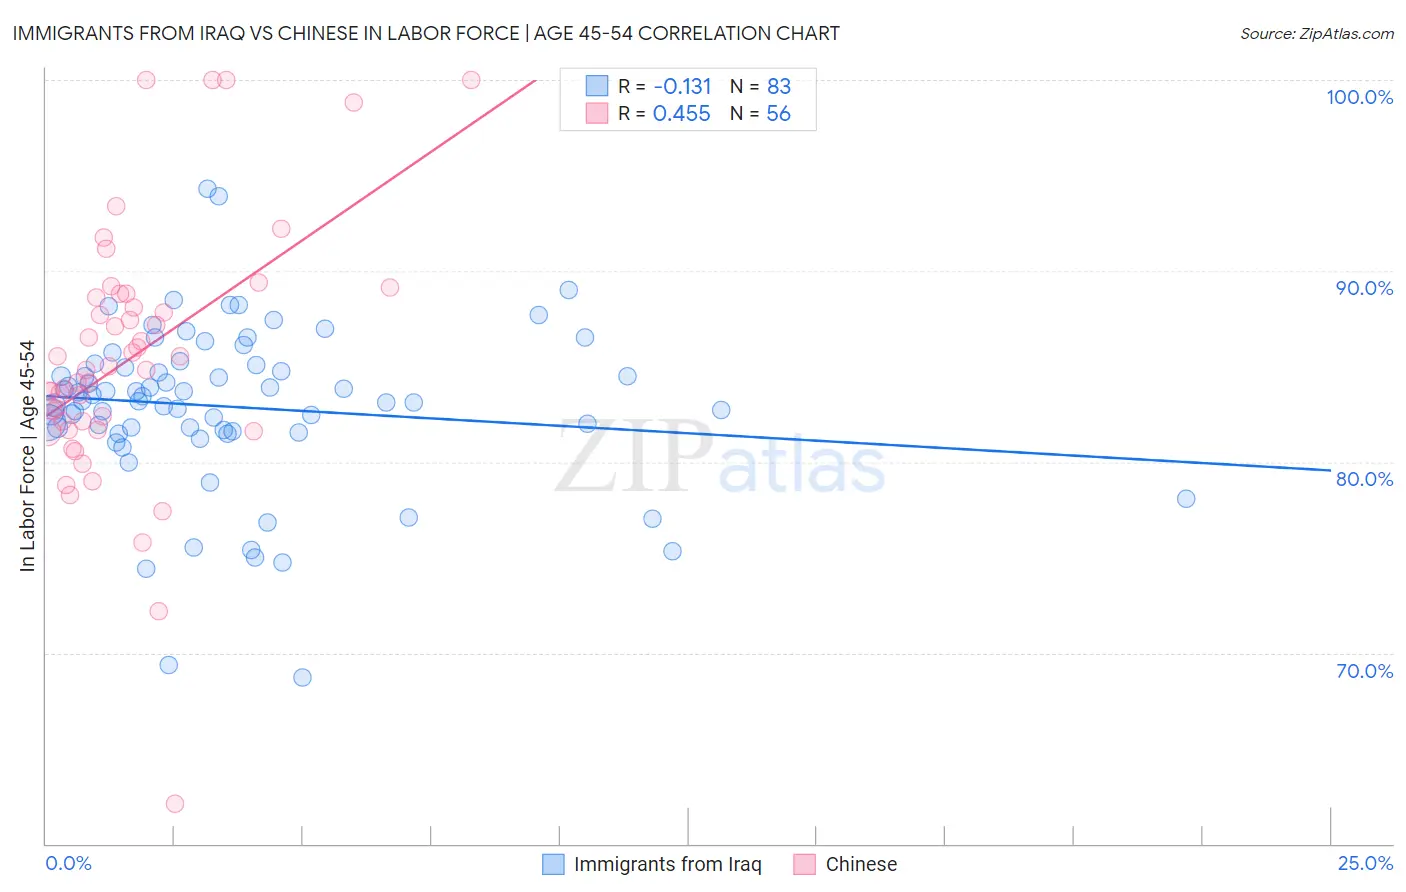
Immigrants from Iraq vs Chinese In Labor Force | Age 45-54 Correlation Chart
The statistical analysis conducted on geographies consisting of 194,753,742 people shows a poor negative correlation between the proportion of Immigrants from Iraq and labor force participation rate among population between the ages 45 and 54 in the United States with a correlation coefficient (R) of -0.131 and weighted average of 82.5%. Similarly, the statistical analysis conducted on geographies consisting of 64,795,821 people shows a moderate positive correlation between the proportion of Chinese and labor force participation rate among population between the ages 45 and 54 in the United States with a correlation coefficient (R) of 0.455 and weighted average of 84.1%, a difference of 2.0%.
In Labor Force | Age 45-54 Correlation Summary
| Measurement | Immigrants from Iraq | Chinese |
| Minimum | 68.7% | 62.1% |
| Maximum | 94.3% | 100.0% |
| Range | 25.6% | 37.9% |
| Mean | 82.9% | 85.5% |
| Median | 83.2% | 84.9% |
| Interquartile 25% (IQ1) | 81.6% | 81.9% |
| Interquartile 75% (IQ3) | 85.1% | 88.7% |
| Interquartile Range (IQR) | 3.5% | 6.8% |
| Standard Deviation (Sample) | 4.3% | 6.8% |
| Standard Deviation (Population) | 4.3% | 6.7% |
Similar Demographics by In Labor Force | Age 45-54
Demographics Similar to Immigrants from Iraq by In Labor Force | Age 45-54
In terms of in labor force | age 45-54, the demographic groups most similar to Immigrants from Iraq are Australian (82.5%, a difference of 0.0%), Immigrants from Norway (82.5%, a difference of 0.0%), Immigrants from Canada (82.5%, a difference of 0.010%), Armenian (82.5%, a difference of 0.030%), and Immigrants from North America (82.5%, a difference of 0.030%).
| Demographics | Rating | Rank | In Labor Force | Age 45-54 |
| Immigrants | England | 32.2 /100 | #185 | Fair 82.6% |
| Irish | 29.2 /100 | #186 | Fair 82.6% |
| Immigrants | Costa Rica | 28.3 /100 | #187 | Fair 82.6% |
| South Africans | 28.0 /100 | #188 | Fair 82.6% |
| Syrians | 26.0 /100 | #189 | Fair 82.6% |
| British | 25.7 /100 | #190 | Fair 82.6% |
| Armenians | 23.2 /100 | #191 | Fair 82.5% |
| Immigrants | Iraq | 20.9 /100 | #192 | Fair 82.5% |
| Australians | 20.8 /100 | #193 | Fair 82.5% |
| Immigrants | Norway | 20.7 /100 | #194 | Fair 82.5% |
| Immigrants | Canada | 20.0 /100 | #195 | Fair 82.5% |
| Immigrants | North America | 18.8 /100 | #196 | Poor 82.5% |
| Lebanese | 18.2 /100 | #197 | Poor 82.5% |
| Immigrants | Denmark | 17.9 /100 | #198 | Poor 82.5% |
| Moroccans | 15.7 /100 | #199 | Poor 82.5% |
Demographics Similar to Chinese by In Labor Force | Age 45-54
In terms of in labor force | age 45-54, the demographic groups most similar to Chinese are Cambodian (84.1%, a difference of 0.030%), Cypriot (84.1%, a difference of 0.090%), Bulgarian (84.2%, a difference of 0.11%), Immigrants from Nepal (84.0%, a difference of 0.11%), and Zimbabwean (84.0%, a difference of 0.13%).
| Demographics | Rating | Rank | In Labor Force | Age 45-54 |
| Immigrants | India | 100.0 /100 | #6 | Exceptional 84.7% |
| Immigrants | Cameroon | 100.0 /100 | #7 | Exceptional 84.6% |
| Sierra Leoneans | 100.0 /100 | #8 | Exceptional 84.5% |
| Immigrants | Sierra Leone | 100.0 /100 | #9 | Exceptional 84.4% |
| Norwegians | 100.0 /100 | #10 | Exceptional 84.4% |
| Thais | 100.0 /100 | #11 | Exceptional 84.3% |
| Bulgarians | 100.0 /100 | #12 | Exceptional 84.2% |
| Chinese | 99.9 /100 | #13 | Exceptional 84.1% |
| Cambodians | 99.9 /100 | #14 | Exceptional 84.1% |
| Cypriots | 99.9 /100 | #15 | Exceptional 84.1% |
| Immigrants | Nepal | 99.9 /100 | #16 | Exceptional 84.0% |
| Zimbabweans | 99.9 /100 | #17 | Exceptional 84.0% |
| Immigrants | South Central Asia | 99.9 /100 | #18 | Exceptional 84.0% |
| Czechs | 99.8 /100 | #19 | Exceptional 83.9% |
| Immigrants | Eastern Africa | 99.8 /100 | #20 | Exceptional 83.9% |