Immigrants from Burma/Myanmar vs Ukrainian In Labor Force | Age 45-54
COMPARE
Immigrants from Burma/Myanmar
Ukrainian
In Labor Force | Age 45-54
In Labor Force | Age 45-54 Comparison
Immigrants from Burma/Myanmar
Ukrainians
82.0%
IN LABOR FORCE | AGE 45-54
1.9/ 100
METRIC RATING
229th/ 347
METRIC RANK
83.2%
IN LABOR FORCE | AGE 45-54
92.7/ 100
METRIC RATING
109th/ 347
METRIC RANK
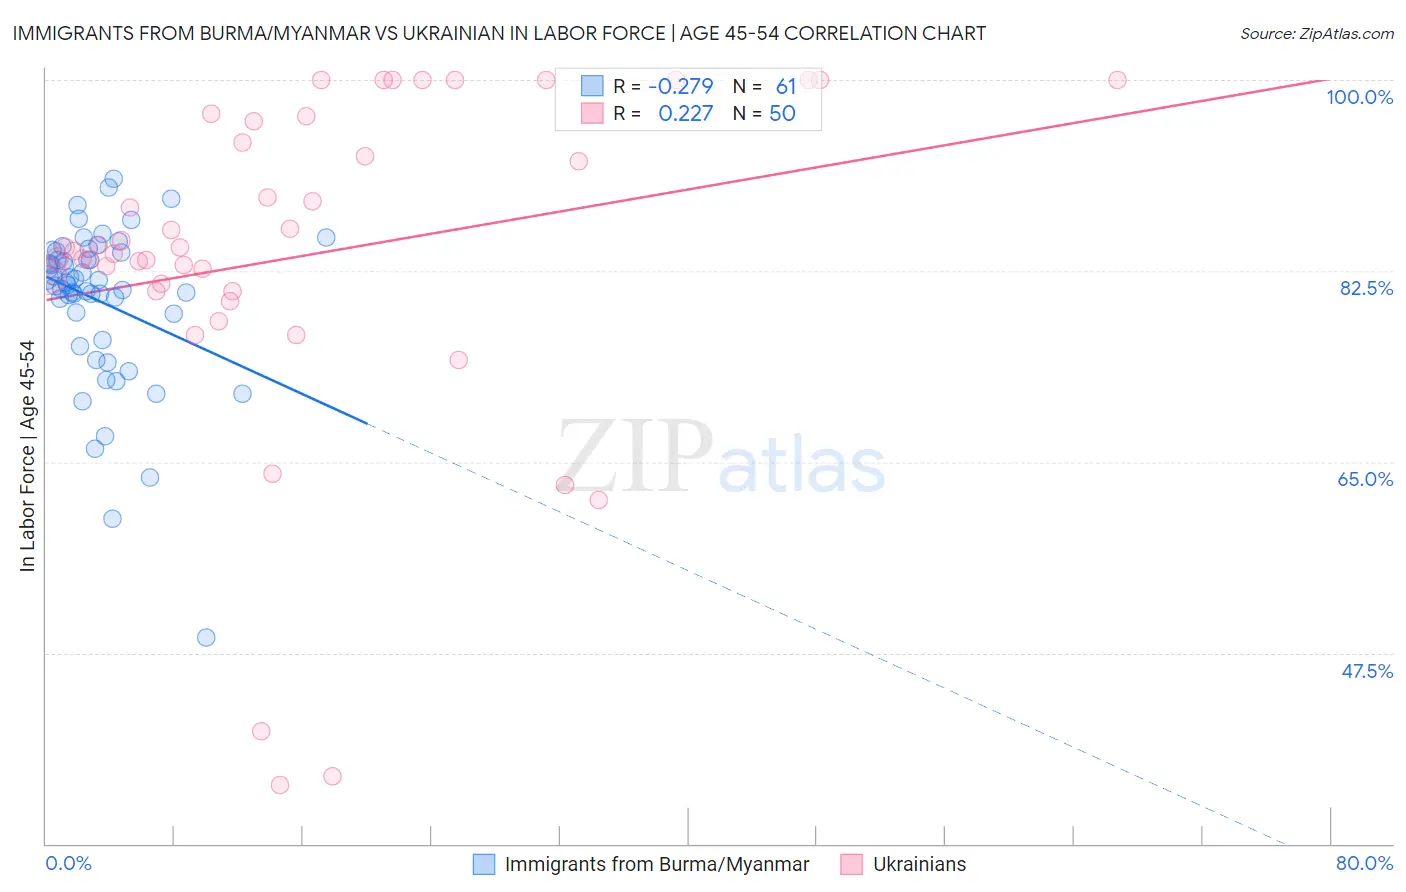
Immigrants from Burma/Myanmar vs Ukrainian In Labor Force | Age 45-54 Correlation Chart
The statistical analysis conducted on geographies consisting of 172,276,017 people shows a weak negative correlation between the proportion of Immigrants from Burma/Myanmar and labor force participation rate among population between the ages 45 and 54 in the United States with a correlation coefficient (R) of -0.279 and weighted average of 82.0%. Similarly, the statistical analysis conducted on geographies consisting of 448,292,186 people shows a weak positive correlation between the proportion of Ukrainians and labor force participation rate among population between the ages 45 and 54 in the United States with a correlation coefficient (R) of 0.227 and weighted average of 83.2%, a difference of 1.4%.
In Labor Force | Age 45-54 Correlation Summary
| Measurement | Immigrants from Burma/Myanmar | Ukrainian |
| Minimum | 48.9% | 35.3% |
| Maximum | 90.9% | 100.0% |
| Range | 42.0% | 64.7% |
| Mean | 79.7% | 83.9% |
| Median | 81.5% | 84.5% |
| Interquartile 25% (IQ1) | 77.4% | 80.7% |
| Interquartile 75% (IQ3) | 84.3% | 96.2% |
| Interquartile Range (IQR) | 6.9% | 15.5% |
| Standard Deviation (Sample) | 7.5% | 15.4% |
| Standard Deviation (Population) | 7.4% | 15.2% |
Similar Demographics by In Labor Force | Age 45-54
Demographics Similar to Immigrants from Burma/Myanmar by In Labor Force | Age 45-54
In terms of in labor force | age 45-54, the demographic groups most similar to Immigrants from Burma/Myanmar are Jamaican (82.0%, a difference of 0.010%), Cape Verdean (82.1%, a difference of 0.020%), Immigrants from Senegal (82.0%, a difference of 0.030%), Immigrants from Portugal (82.0%, a difference of 0.030%), and Malaysian (82.0%, a difference of 0.030%).
| Demographics | Rating | Rank | In Labor Force | Age 45-54 |
| Immigrants | Ecuador | 3.4 /100 | #222 | Tragic 82.2% |
| Immigrants | Immigrants | 3.1 /100 | #223 | Tragic 82.1% |
| Immigrants | Jamaica | 2.7 /100 | #224 | Tragic 82.1% |
| Immigrants | Oceania | 2.5 /100 | #225 | Tragic 82.1% |
| Immigrants | Caribbean | 2.5 /100 | #226 | Tragic 82.1% |
| Immigrants | Germany | 2.4 /100 | #227 | Tragic 82.1% |
| Cape Verdeans | 2.1 /100 | #228 | Tragic 82.1% |
| Immigrants | Burma/Myanmar | 1.9 /100 | #229 | Tragic 82.0% |
| Jamaicans | 1.8 /100 | #230 | Tragic 82.0% |
| Immigrants | Senegal | 1.7 /100 | #231 | Tragic 82.0% |
| Immigrants | Portugal | 1.7 /100 | #232 | Tragic 82.0% |
| Malaysians | 1.7 /100 | #233 | Tragic 82.0% |
| Salvadorans | 1.7 /100 | #234 | Tragic 82.0% |
| Sub-Saharan Africans | 1.2 /100 | #235 | Tragic 82.0% |
| Basques | 1.2 /100 | #236 | Tragic 82.0% |
Demographics Similar to Ukrainians by In Labor Force | Age 45-54
In terms of in labor force | age 45-54, the demographic groups most similar to Ukrainians are Slovak (83.2%, a difference of 0.0%), Immigrants from Africa (83.2%, a difference of 0.0%), Iranian (83.2%, a difference of 0.010%), Immigrants from Italy (83.2%, a difference of 0.010%), and Immigrants from Afghanistan (83.2%, a difference of 0.010%).
| Demographics | Rating | Rank | In Labor Force | Age 45-54 |
| Immigrants | Singapore | 93.9 /100 | #102 | Exceptional 83.3% |
| Albanians | 93.9 /100 | #103 | Exceptional 83.3% |
| Immigrants | Romania | 93.8 /100 | #104 | Exceptional 83.3% |
| Immigrants | South America | 93.5 /100 | #105 | Exceptional 83.2% |
| Sri Lankans | 93.2 /100 | #106 | Exceptional 83.2% |
| Iranians | 92.9 /100 | #107 | Exceptional 83.2% |
| Slovaks | 92.8 /100 | #108 | Exceptional 83.2% |
| Ukrainians | 92.7 /100 | #109 | Exceptional 83.2% |
| Immigrants | Africa | 92.6 /100 | #110 | Exceptional 83.2% |
| Immigrants | Italy | 92.5 /100 | #111 | Exceptional 83.2% |
| Immigrants | Afghanistan | 92.4 /100 | #112 | Exceptional 83.2% |
| Immigrants | Albania | 91.8 /100 | #113 | Exceptional 83.2% |
| Assyrians/Chaldeans/Syriacs | 91.7 /100 | #114 | Exceptional 83.2% |
| Immigrants | Chile | 91.6 /100 | #115 | Exceptional 83.2% |
| Immigrants | Malaysia | 91.4 /100 | #116 | Exceptional 83.2% |