Immigrants from Iraq vs Ukrainian Family Households
COMPARE
Immigrants from Iraq
Ukrainian
Family Households
Family Households Comparison
Immigrants from Iraq
Ukrainians
65.0%
FAMILY HOUSEHOLDS
95.4/ 100
METRIC RATING
116th/ 347
METRIC RANK
64.2%
FAMILY HOUSEHOLDS
34.6/ 100
METRIC RATING
182nd/ 347
METRIC RANK
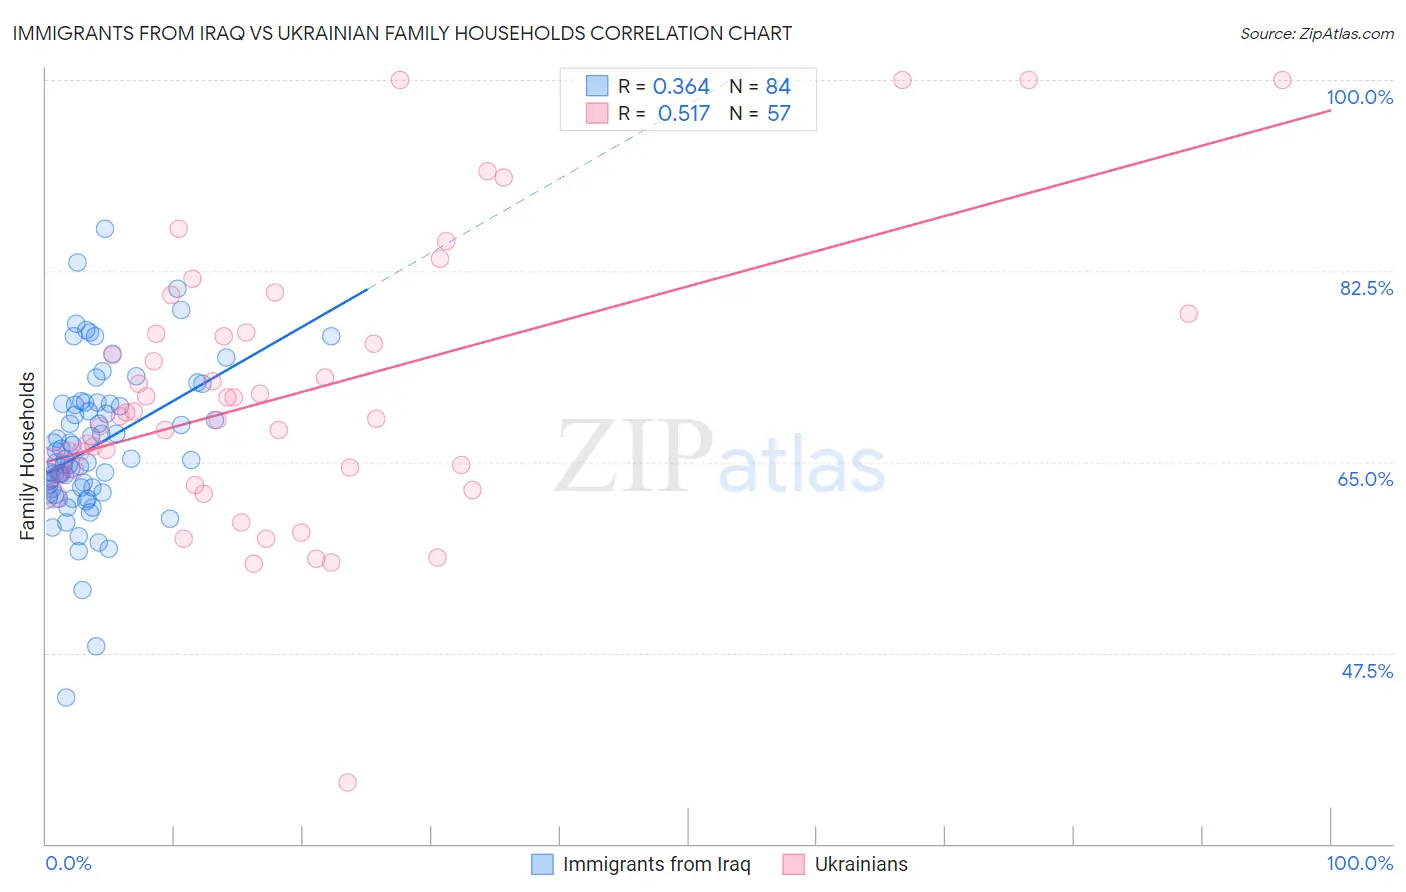
Immigrants from Iraq vs Ukrainian Family Households Correlation Chart
The statistical analysis conducted on geographies consisting of 194,748,040 people shows a mild positive correlation between the proportion of Immigrants from Iraq and percentage of family households in the United States with a correlation coefficient (R) of 0.364 and weighted average of 65.0%. Similarly, the statistical analysis conducted on geographies consisting of 448,323,660 people shows a substantial positive correlation between the proportion of Ukrainians and percentage of family households in the United States with a correlation coefficient (R) of 0.517 and weighted average of 64.2%, a difference of 1.2%.
Family Households Correlation Summary
| Measurement | Immigrants from Iraq | Ukrainian |
| Minimum | 43.4% | 35.6% |
| Maximum | 86.3% | 100.0% |
| Range | 43.0% | 64.4% |
| Mean | 66.4% | 71.3% |
| Median | 65.2% | 69.2% |
| Interquartile 25% (IQ1) | 62.3% | 64.0% |
| Interquartile 75% (IQ3) | 70.4% | 76.8% |
| Interquartile Range (IQR) | 8.0% | 12.8% |
| Standard Deviation (Sample) | 7.1% | 12.5% |
| Standard Deviation (Population) | 7.0% | 12.4% |
Similar Demographics by Family Households
Demographics Similar to Immigrants from Iraq by Family Households
In terms of family households, the demographic groups most similar to Immigrants from Iraq are Ecuadorian (65.0%, a difference of 0.0%), Cherokee (65.0%, a difference of 0.0%), Dutch (64.9%, a difference of 0.020%), Argentinean (65.0%, a difference of 0.030%), and Spanish (65.0%, a difference of 0.070%).
| Demographics | Rating | Rank | Family Households |
| Immigrants | Guatemala | 96.9 /100 | #109 | Exceptional 65.0% |
| Scandinavians | 96.8 /100 | #110 | Exceptional 65.0% |
| Europeans | 96.8 /100 | #111 | Exceptional 65.0% |
| Immigrants | Jordan | 96.5 /100 | #112 | Exceptional 65.0% |
| Spanish | 96.2 /100 | #113 | Exceptional 65.0% |
| Argentineans | 95.7 /100 | #114 | Exceptional 65.0% |
| Ecuadorians | 95.4 /100 | #115 | Exceptional 65.0% |
| Immigrants | Iraq | 95.4 /100 | #116 | Exceptional 65.0% |
| Cherokee | 95.3 /100 | #117 | Exceptional 65.0% |
| Dutch | 95.1 /100 | #118 | Exceptional 64.9% |
| Immigrants | Eastern Asia | 94.4 /100 | #119 | Exceptional 64.9% |
| Immigrants | Oceania | 94.2 /100 | #120 | Exceptional 64.9% |
| Hungarians | 94.0 /100 | #121 | Exceptional 64.9% |
| Hmong | 93.4 /100 | #122 | Exceptional 64.9% |
| Choctaw | 93.4 /100 | #123 | Exceptional 64.9% |
Demographics Similar to Ukrainians by Family Households
In terms of family households, the demographic groups most similar to Ukrainians are Immigrants from Honduras (64.2%, a difference of 0.0%), Immigrants from Trinidad and Tobago (64.2%, a difference of 0.0%), Creek (64.2%, a difference of 0.010%), Puerto Rican (64.2%, a difference of 0.020%), and Immigrants from Ukraine (64.2%, a difference of 0.050%).
| Demographics | Rating | Rank | Family Households |
| Bangladeshis | 44.3 /100 | #175 | Average 64.3% |
| Vietnamese | 43.6 /100 | #176 | Average 64.2% |
| Immigrants | Micronesia | 42.3 /100 | #177 | Average 64.2% |
| Jamaicans | 40.6 /100 | #178 | Average 64.2% |
| Immigrants | Ukraine | 38.2 /100 | #179 | Fair 64.2% |
| Immigrants | Honduras | 35.0 /100 | #180 | Fair 64.2% |
| Immigrants | Trinidad and Tobago | 34.9 /100 | #181 | Fair 64.2% |
| Ukrainians | 34.6 /100 | #182 | Fair 64.2% |
| Creek | 34.1 /100 | #183 | Fair 64.2% |
| Puerto Ricans | 33.4 /100 | #184 | Fair 64.2% |
| Immigrants | Iran | 30.4 /100 | #185 | Fair 64.1% |
| Spanish Americans | 30.1 /100 | #186 | Fair 64.1% |
| Northern Europeans | 28.2 /100 | #187 | Fair 64.1% |
| Paraguayans | 26.7 /100 | #188 | Fair 64.1% |
| Immigrants | Western Asia | 25.3 /100 | #189 | Fair 64.1% |