Immigrants from Iraq vs Guamanian/Chamorro In Labor Force | Age 45-54
COMPARE
Immigrants from Iraq
Guamanian/Chamorro
In Labor Force | Age 45-54
In Labor Force | Age 45-54 Comparison
Immigrants from Iraq
Guamanians/Chamorros
82.5%
IN LABOR FORCE | AGE 45-54
20.9/ 100
METRIC RATING
192nd/ 347
METRIC RANK
81.6%
IN LABOR FORCE | AGE 45-54
0.2/ 100
METRIC RATING
251st/ 347
METRIC RANK
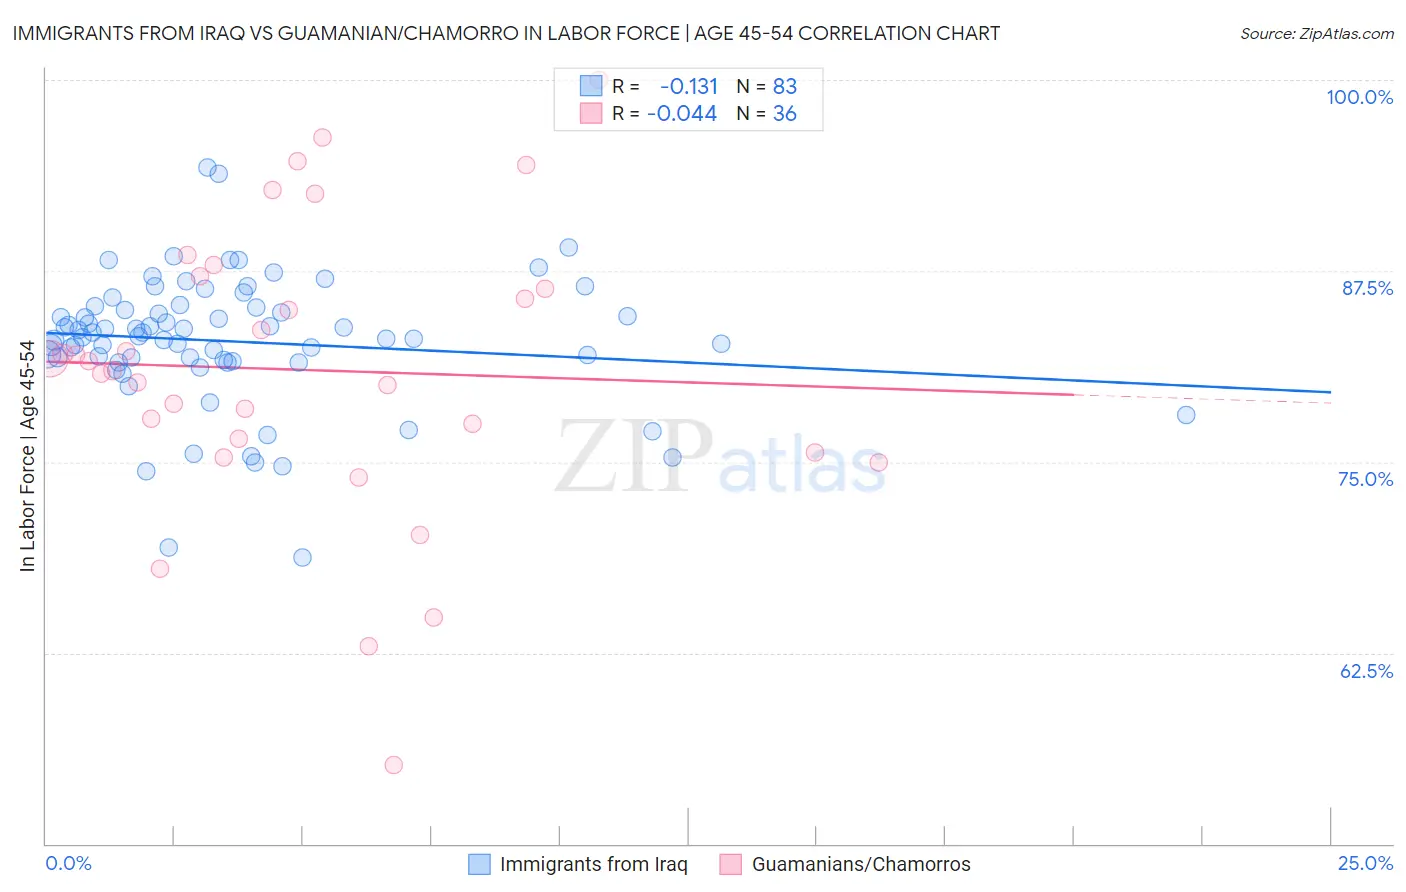
Immigrants from Iraq vs Guamanian/Chamorro In Labor Force | Age 45-54 Correlation Chart
The statistical analysis conducted on geographies consisting of 194,753,742 people shows a poor negative correlation between the proportion of Immigrants from Iraq and labor force participation rate among population between the ages 45 and 54 in the United States with a correlation coefficient (R) of -0.131 and weighted average of 82.5%. Similarly, the statistical analysis conducted on geographies consisting of 221,888,798 people shows no correlation between the proportion of Guamanians/Chamorros and labor force participation rate among population between the ages 45 and 54 in the United States with a correlation coefficient (R) of -0.044 and weighted average of 81.6%, a difference of 1.1%.
In Labor Force | Age 45-54 Correlation Summary
| Measurement | Immigrants from Iraq | Guamanian/Chamorro |
| Minimum | 68.7% | 55.2% |
| Maximum | 94.3% | 100.0% |
| Range | 25.6% | 44.8% |
| Mean | 82.9% | 81.0% |
| Median | 83.2% | 81.3% |
| Interquartile 25% (IQ1) | 81.6% | 76.0% |
| Interquartile 75% (IQ3) | 85.1% | 86.7% |
| Interquartile Range (IQR) | 3.5% | 10.7% |
| Standard Deviation (Sample) | 4.3% | 9.6% |
| Standard Deviation (Population) | 4.3% | 9.4% |
Similar Demographics by In Labor Force | Age 45-54
Demographics Similar to Immigrants from Iraq by In Labor Force | Age 45-54
In terms of in labor force | age 45-54, the demographic groups most similar to Immigrants from Iraq are Australian (82.5%, a difference of 0.0%), Immigrants from Norway (82.5%, a difference of 0.0%), Immigrants from Canada (82.5%, a difference of 0.010%), Armenian (82.5%, a difference of 0.030%), and Immigrants from North America (82.5%, a difference of 0.030%).
| Demographics | Rating | Rank | In Labor Force | Age 45-54 |
| Immigrants | England | 32.2 /100 | #185 | Fair 82.6% |
| Irish | 29.2 /100 | #186 | Fair 82.6% |
| Immigrants | Costa Rica | 28.3 /100 | #187 | Fair 82.6% |
| South Africans | 28.0 /100 | #188 | Fair 82.6% |
| Syrians | 26.0 /100 | #189 | Fair 82.6% |
| British | 25.7 /100 | #190 | Fair 82.6% |
| Armenians | 23.2 /100 | #191 | Fair 82.5% |
| Immigrants | Iraq | 20.9 /100 | #192 | Fair 82.5% |
| Australians | 20.8 /100 | #193 | Fair 82.5% |
| Immigrants | Norway | 20.7 /100 | #194 | Fair 82.5% |
| Immigrants | Canada | 20.0 /100 | #195 | Fair 82.5% |
| Immigrants | North America | 18.8 /100 | #196 | Poor 82.5% |
| Lebanese | 18.2 /100 | #197 | Poor 82.5% |
| Immigrants | Denmark | 17.9 /100 | #198 | Poor 82.5% |
| Moroccans | 15.7 /100 | #199 | Poor 82.5% |
Demographics Similar to Guamanians/Chamorros by In Labor Force | Age 45-54
In terms of in labor force | age 45-54, the demographic groups most similar to Guamanians/Chamorros are Immigrants from Armenia (81.7%, a difference of 0.020%), Pennsylvania German (81.6%, a difference of 0.020%), Japanese (81.6%, a difference of 0.040%), Immigrants from Laos (81.6%, a difference of 0.050%), and Scotch-Irish (81.6%, a difference of 0.060%).
| Demographics | Rating | Rank | In Labor Force | Age 45-54 |
| Celtics | 0.4 /100 | #244 | Tragic 81.8% |
| Alaska Natives | 0.4 /100 | #245 | Tragic 81.8% |
| Alaskan Athabascans | 0.4 /100 | #246 | Tragic 81.8% |
| Central Americans | 0.4 /100 | #247 | Tragic 81.7% |
| Puget Sound Salish | 0.3 /100 | #248 | Tragic 81.7% |
| Hmong | 0.3 /100 | #249 | Tragic 81.7% |
| Immigrants | Armenia | 0.2 /100 | #250 | Tragic 81.7% |
| Guamanians/Chamorros | 0.2 /100 | #251 | Tragic 81.6% |
| Pennsylvania Germans | 0.2 /100 | #252 | Tragic 81.6% |
| Japanese | 0.2 /100 | #253 | Tragic 81.6% |
| Immigrants | Laos | 0.2 /100 | #254 | Tragic 81.6% |
| Scotch-Irish | 0.2 /100 | #255 | Tragic 81.6% |
| Barbadians | 0.1 /100 | #256 | Tragic 81.6% |
| Immigrants | Congo | 0.1 /100 | #257 | Tragic 81.6% |
| Immigrants | Fiji | 0.1 /100 | #258 | Tragic 81.5% |