Immigrants from Iraq vs Paiute In Labor Force | Age 45-54
COMPARE
Immigrants from Iraq
Paiute
In Labor Force | Age 45-54
In Labor Force | Age 45-54 Comparison
Immigrants from Iraq
Paiute
82.5%
IN LABOR FORCE | AGE 45-54
20.9/ 100
METRIC RATING
192nd/ 347
METRIC RANK
76.7%
IN LABOR FORCE | AGE 45-54
0.0/ 100
METRIC RATING
336th/ 347
METRIC RANK
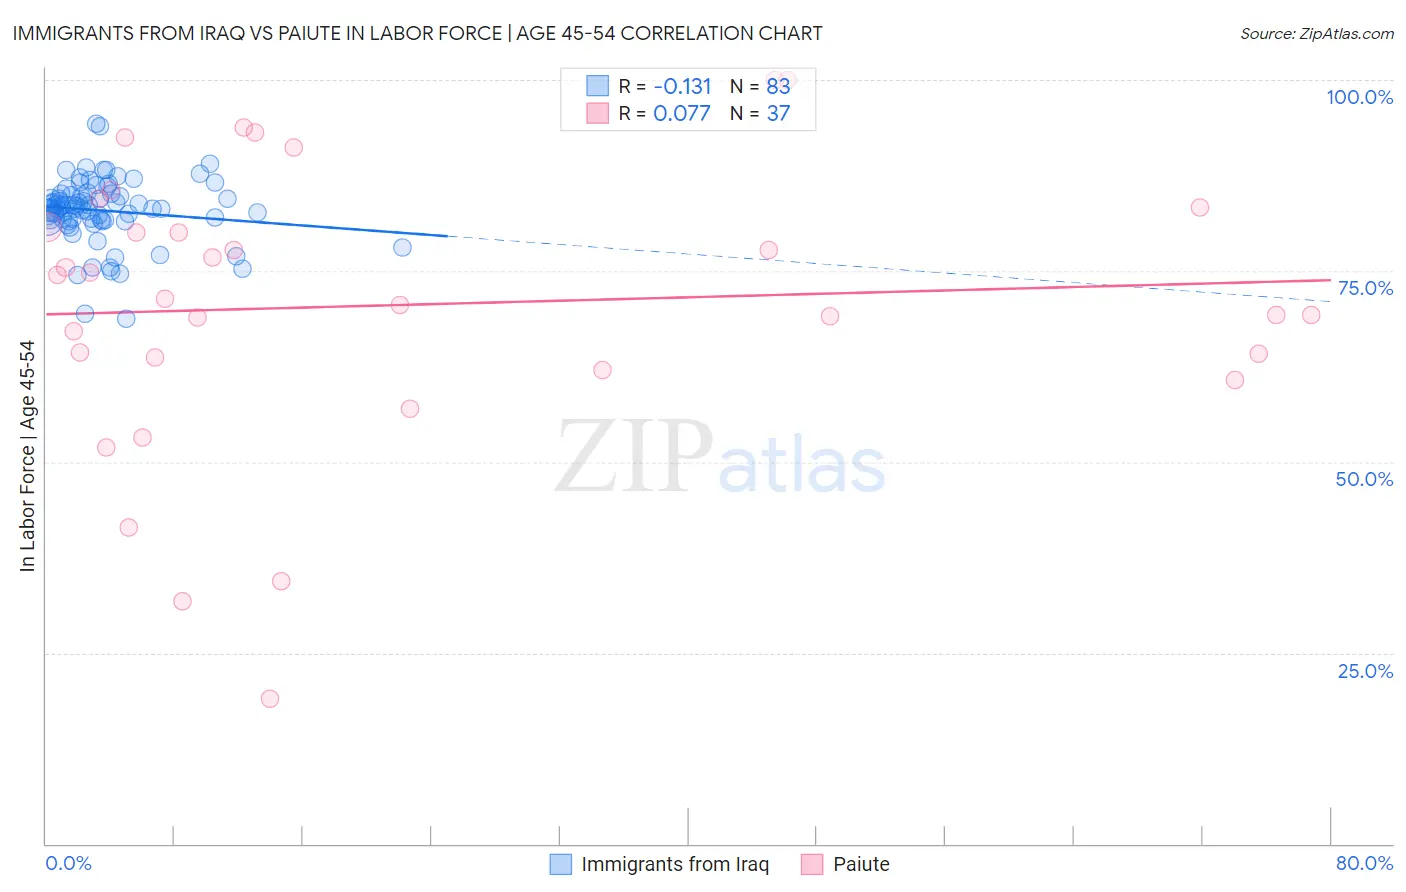
Immigrants from Iraq vs Paiute In Labor Force | Age 45-54 Correlation Chart
The statistical analysis conducted on geographies consisting of 194,753,742 people shows a poor negative correlation between the proportion of Immigrants from Iraq and labor force participation rate among population between the ages 45 and 54 in the United States with a correlation coefficient (R) of -0.131 and weighted average of 82.5%. Similarly, the statistical analysis conducted on geographies consisting of 58,396,210 people shows a slight positive correlation between the proportion of Paiute and labor force participation rate among population between the ages 45 and 54 in the United States with a correlation coefficient (R) of 0.077 and weighted average of 76.7%, a difference of 7.6%.
In Labor Force | Age 45-54 Correlation Summary
| Measurement | Immigrants from Iraq | Paiute |
| Minimum | 68.7% | 19.0% |
| Maximum | 94.3% | 100.0% |
| Range | 25.6% | 81.0% |
| Mean | 82.9% | 70.5% |
| Median | 83.2% | 71.4% |
| Interquartile 25% (IQ1) | 81.6% | 62.9% |
| Interquartile 75% (IQ3) | 85.1% | 82.0% |
| Interquartile Range (IQR) | 3.5% | 19.1% |
| Standard Deviation (Sample) | 4.3% | 18.4% |
| Standard Deviation (Population) | 4.3% | 18.2% |
Similar Demographics by In Labor Force | Age 45-54
Demographics Similar to Immigrants from Iraq by In Labor Force | Age 45-54
In terms of in labor force | age 45-54, the demographic groups most similar to Immigrants from Iraq are Australian (82.5%, a difference of 0.0%), Immigrants from Norway (82.5%, a difference of 0.0%), Immigrants from Canada (82.5%, a difference of 0.010%), Armenian (82.5%, a difference of 0.030%), and Immigrants from North America (82.5%, a difference of 0.030%).
| Demographics | Rating | Rank | In Labor Force | Age 45-54 |
| Immigrants | England | 32.2 /100 | #185 | Fair 82.6% |
| Irish | 29.2 /100 | #186 | Fair 82.6% |
| Immigrants | Costa Rica | 28.3 /100 | #187 | Fair 82.6% |
| South Africans | 28.0 /100 | #188 | Fair 82.6% |
| Syrians | 26.0 /100 | #189 | Fair 82.6% |
| British | 25.7 /100 | #190 | Fair 82.6% |
| Armenians | 23.2 /100 | #191 | Fair 82.5% |
| Immigrants | Iraq | 20.9 /100 | #192 | Fair 82.5% |
| Australians | 20.8 /100 | #193 | Fair 82.5% |
| Immigrants | Norway | 20.7 /100 | #194 | Fair 82.5% |
| Immigrants | Canada | 20.0 /100 | #195 | Fair 82.5% |
| Immigrants | North America | 18.8 /100 | #196 | Poor 82.5% |
| Lebanese | 18.2 /100 | #197 | Poor 82.5% |
| Immigrants | Denmark | 17.9 /100 | #198 | Poor 82.5% |
| Moroccans | 15.7 /100 | #199 | Poor 82.5% |
Demographics Similar to Paiute by In Labor Force | Age 45-54
In terms of in labor force | age 45-54, the demographic groups most similar to Paiute are Ute (76.6%, a difference of 0.060%), Yuman (76.3%, a difference of 0.47%), Arapaho (77.1%, a difference of 0.54%), Native/Alaskan (77.1%, a difference of 0.61%), and Apache (77.1%, a difference of 0.61%).
| Demographics | Rating | Rank | In Labor Force | Age 45-54 |
| Creek | 0.0 /100 | #329 | Tragic 77.7% |
| Cheyenne | 0.0 /100 | #330 | Tragic 77.6% |
| Tsimshian | 0.0 /100 | #331 | Tragic 77.4% |
| Menominee | 0.0 /100 | #332 | Tragic 77.4% |
| Natives/Alaskans | 0.0 /100 | #333 | Tragic 77.1% |
| Apache | 0.0 /100 | #334 | Tragic 77.1% |
| Arapaho | 0.0 /100 | #335 | Tragic 77.1% |
| Paiute | 0.0 /100 | #336 | Tragic 76.7% |
| Ute | 0.0 /100 | #337 | Tragic 76.6% |
| Yuman | 0.0 /100 | #338 | Tragic 76.3% |
| Puerto Ricans | 0.0 /100 | #339 | Tragic 75.9% |
| Lumbee | 0.0 /100 | #340 | Tragic 75.6% |
| Pueblo | 0.0 /100 | #341 | Tragic 75.5% |
| Tohono O'odham | 0.0 /100 | #342 | Tragic 75.1% |
| Hopi | 0.0 /100 | #343 | Tragic 75.0% |