Guamanian/Chamorro vs Ukrainian In Labor Force | Age 45-54
COMPARE
Guamanian/Chamorro
Ukrainian
In Labor Force | Age 45-54
In Labor Force | Age 45-54 Comparison
Guamanians/Chamorros
Ukrainians
81.6%
IN LABOR FORCE | AGE 45-54
0.2/ 100
METRIC RATING
251st/ 347
METRIC RANK
83.2%
IN LABOR FORCE | AGE 45-54
92.7/ 100
METRIC RATING
109th/ 347
METRIC RANK
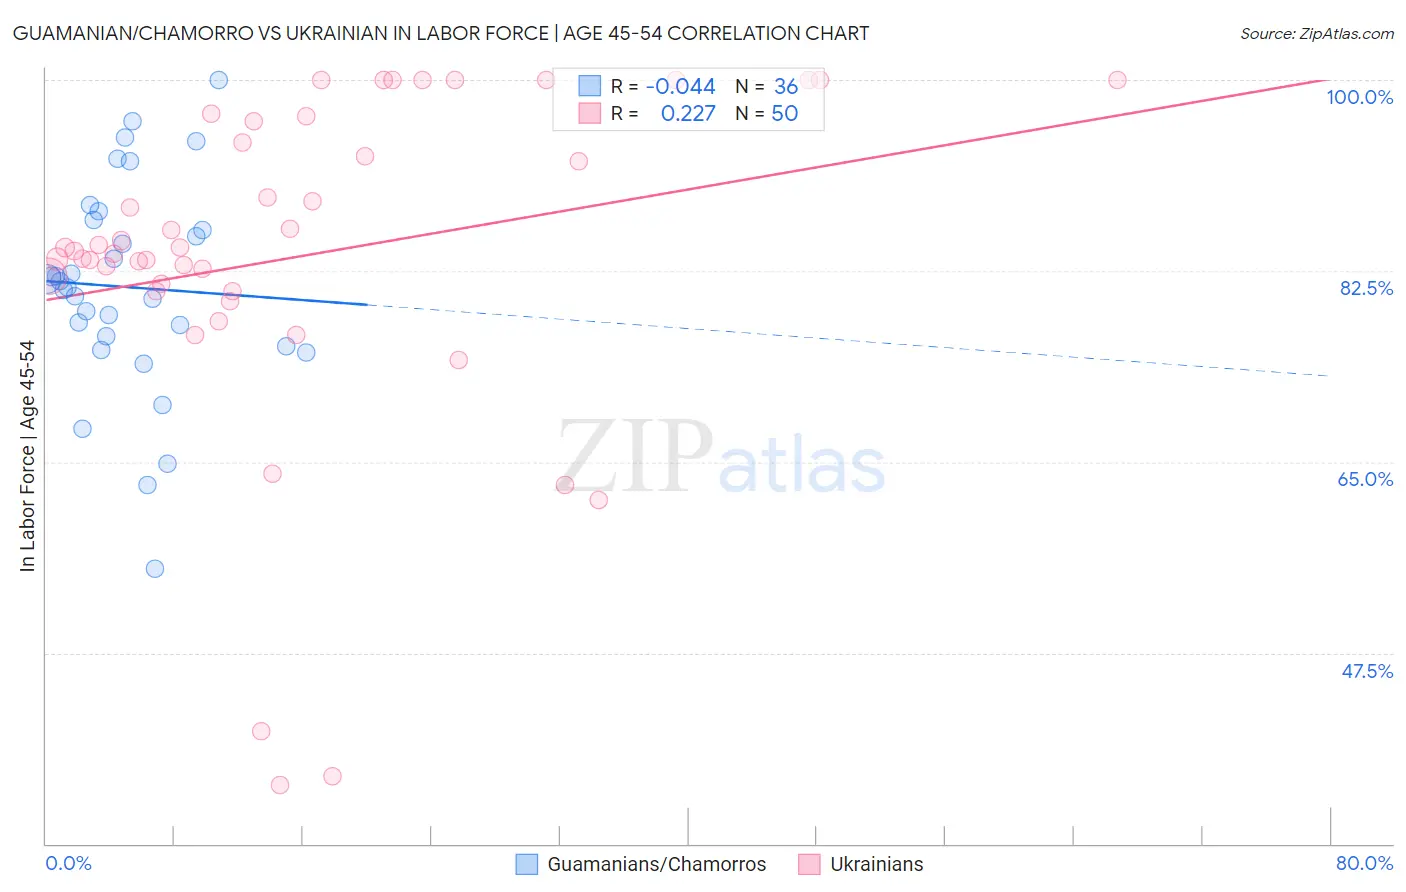
Guamanian/Chamorro vs Ukrainian In Labor Force | Age 45-54 Correlation Chart
The statistical analysis conducted on geographies consisting of 221,888,798 people shows no correlation between the proportion of Guamanians/Chamorros and labor force participation rate among population between the ages 45 and 54 in the United States with a correlation coefficient (R) of -0.044 and weighted average of 81.6%. Similarly, the statistical analysis conducted on geographies consisting of 448,292,186 people shows a weak positive correlation between the proportion of Ukrainians and labor force participation rate among population between the ages 45 and 54 in the United States with a correlation coefficient (R) of 0.227 and weighted average of 83.2%, a difference of 1.9%.
In Labor Force | Age 45-54 Correlation Summary
| Measurement | Guamanian/Chamorro | Ukrainian |
| Minimum | 55.2% | 35.3% |
| Maximum | 100.0% | 100.0% |
| Range | 44.8% | 64.7% |
| Mean | 81.0% | 83.9% |
| Median | 81.3% | 84.5% |
| Interquartile 25% (IQ1) | 76.0% | 80.7% |
| Interquartile 75% (IQ3) | 86.7% | 96.2% |
| Interquartile Range (IQR) | 10.7% | 15.5% |
| Standard Deviation (Sample) | 9.6% | 15.4% |
| Standard Deviation (Population) | 9.4% | 15.2% |
Similar Demographics by In Labor Force | Age 45-54
Demographics Similar to Guamanians/Chamorros by In Labor Force | Age 45-54
In terms of in labor force | age 45-54, the demographic groups most similar to Guamanians/Chamorros are Immigrants from Armenia (81.7%, a difference of 0.020%), Pennsylvania German (81.6%, a difference of 0.020%), Japanese (81.6%, a difference of 0.040%), Immigrants from Laos (81.6%, a difference of 0.050%), and Scotch-Irish (81.6%, a difference of 0.060%).
| Demographics | Rating | Rank | In Labor Force | Age 45-54 |
| Celtics | 0.4 /100 | #244 | Tragic 81.8% |
| Alaska Natives | 0.4 /100 | #245 | Tragic 81.8% |
| Alaskan Athabascans | 0.4 /100 | #246 | Tragic 81.8% |
| Central Americans | 0.4 /100 | #247 | Tragic 81.7% |
| Puget Sound Salish | 0.3 /100 | #248 | Tragic 81.7% |
| Hmong | 0.3 /100 | #249 | Tragic 81.7% |
| Immigrants | Armenia | 0.2 /100 | #250 | Tragic 81.7% |
| Guamanians/Chamorros | 0.2 /100 | #251 | Tragic 81.6% |
| Pennsylvania Germans | 0.2 /100 | #252 | Tragic 81.6% |
| Japanese | 0.2 /100 | #253 | Tragic 81.6% |
| Immigrants | Laos | 0.2 /100 | #254 | Tragic 81.6% |
| Scotch-Irish | 0.2 /100 | #255 | Tragic 81.6% |
| Barbadians | 0.1 /100 | #256 | Tragic 81.6% |
| Immigrants | Congo | 0.1 /100 | #257 | Tragic 81.6% |
| Immigrants | Fiji | 0.1 /100 | #258 | Tragic 81.5% |
Demographics Similar to Ukrainians by In Labor Force | Age 45-54
In terms of in labor force | age 45-54, the demographic groups most similar to Ukrainians are Slovak (83.2%, a difference of 0.0%), Immigrants from Africa (83.2%, a difference of 0.0%), Iranian (83.2%, a difference of 0.010%), Immigrants from Italy (83.2%, a difference of 0.010%), and Immigrants from Afghanistan (83.2%, a difference of 0.010%).
| Demographics | Rating | Rank | In Labor Force | Age 45-54 |
| Immigrants | Singapore | 93.9 /100 | #102 | Exceptional 83.3% |
| Albanians | 93.9 /100 | #103 | Exceptional 83.3% |
| Immigrants | Romania | 93.8 /100 | #104 | Exceptional 83.3% |
| Immigrants | South America | 93.5 /100 | #105 | Exceptional 83.2% |
| Sri Lankans | 93.2 /100 | #106 | Exceptional 83.2% |
| Iranians | 92.9 /100 | #107 | Exceptional 83.2% |
| Slovaks | 92.8 /100 | #108 | Exceptional 83.2% |
| Ukrainians | 92.7 /100 | #109 | Exceptional 83.2% |
| Immigrants | Africa | 92.6 /100 | #110 | Exceptional 83.2% |
| Immigrants | Italy | 92.5 /100 | #111 | Exceptional 83.2% |
| Immigrants | Afghanistan | 92.4 /100 | #112 | Exceptional 83.2% |
| Immigrants | Albania | 91.8 /100 | #113 | Exceptional 83.2% |
| Assyrians/Chaldeans/Syriacs | 91.7 /100 | #114 | Exceptional 83.2% |
| Immigrants | Chile | 91.6 /100 | #115 | Exceptional 83.2% |
| Immigrants | Malaysia | 91.4 /100 | #116 | Exceptional 83.2% |