Belizean vs Ukrainian In Labor Force | Age 45-54
COMPARE
Belizean
Ukrainian
In Labor Force | Age 45-54
In Labor Force | Age 45-54 Comparison
Belizeans
Ukrainians
80.8%
IN LABOR FORCE | AGE 45-54
0.0/ 100
METRIC RATING
284th/ 347
METRIC RANK
83.2%
IN LABOR FORCE | AGE 45-54
92.7/ 100
METRIC RATING
109th/ 347
METRIC RANK
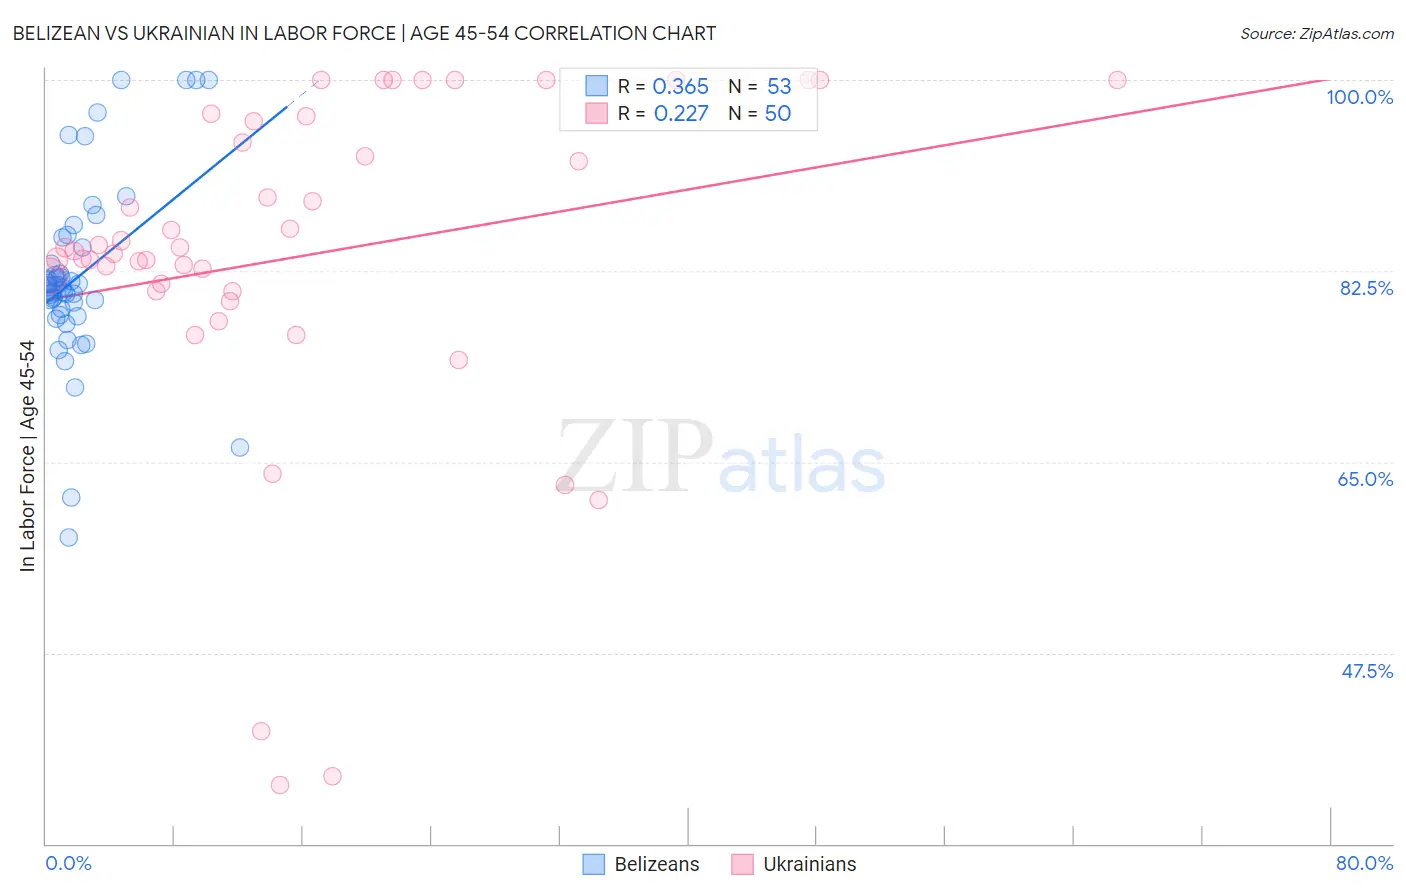
Belizean vs Ukrainian In Labor Force | Age 45-54 Correlation Chart
The statistical analysis conducted on geographies consisting of 144,162,526 people shows a mild positive correlation between the proportion of Belizeans and labor force participation rate among population between the ages 45 and 54 in the United States with a correlation coefficient (R) of 0.365 and weighted average of 80.8%. Similarly, the statistical analysis conducted on geographies consisting of 448,292,186 people shows a weak positive correlation between the proportion of Ukrainians and labor force participation rate among population between the ages 45 and 54 in the United States with a correlation coefficient (R) of 0.227 and weighted average of 83.2%, a difference of 3.0%.
In Labor Force | Age 45-54 Correlation Summary
| Measurement | Belizean | Ukrainian |
| Minimum | 58.1% | 35.3% |
| Maximum | 100.0% | 100.0% |
| Range | 41.9% | 64.7% |
| Mean | 82.0% | 83.9% |
| Median | 81.1% | 84.5% |
| Interquartile 25% (IQ1) | 78.7% | 80.7% |
| Interquartile 75% (IQ3) | 85.1% | 96.2% |
| Interquartile Range (IQR) | 6.4% | 15.5% |
| Standard Deviation (Sample) | 8.4% | 15.4% |
| Standard Deviation (Population) | 8.4% | 15.2% |
Similar Demographics by In Labor Force | Age 45-54
Demographics Similar to Belizeans by In Labor Force | Age 45-54
In terms of in labor force | age 45-54, the demographic groups most similar to Belizeans are Delaware (80.8%, a difference of 0.010%), Immigrants from Dominica (80.8%, a difference of 0.010%), Vietnamese (80.8%, a difference of 0.020%), Cree (80.8%, a difference of 0.020%), and French American Indian (80.8%, a difference of 0.050%).
| Demographics | Rating | Rank | In Labor Force | Age 45-54 |
| Guatemalans | 0.0 /100 | #277 | Tragic 81.2% |
| Immigrants | Guatemala | 0.0 /100 | #278 | Tragic 81.1% |
| Immigrants | Micronesia | 0.0 /100 | #279 | Tragic 81.1% |
| Immigrants | Latin America | 0.0 /100 | #280 | Tragic 81.0% |
| Immigrants | Grenada | 0.0 /100 | #281 | Tragic 81.0% |
| Aleuts | 0.0 /100 | #282 | Tragic 81.0% |
| French American Indians | 0.0 /100 | #283 | Tragic 80.8% |
| Belizeans | 0.0 /100 | #284 | Tragic 80.8% |
| Delaware | 0.0 /100 | #285 | Tragic 80.8% |
| Immigrants | Dominica | 0.0 /100 | #286 | Tragic 80.8% |
| Vietnamese | 0.0 /100 | #287 | Tragic 80.8% |
| Cree | 0.0 /100 | #288 | Tragic 80.8% |
| Immigrants | Bangladesh | 0.0 /100 | #289 | Tragic 80.7% |
| Mexican American Indians | 0.0 /100 | #290 | Tragic 80.7% |
| Immigrants | Belize | 0.0 /100 | #291 | Tragic 80.6% |
Demographics Similar to Ukrainians by In Labor Force | Age 45-54
In terms of in labor force | age 45-54, the demographic groups most similar to Ukrainians are Slovak (83.2%, a difference of 0.0%), Immigrants from Africa (83.2%, a difference of 0.0%), Iranian (83.2%, a difference of 0.010%), Immigrants from Italy (83.2%, a difference of 0.010%), and Immigrants from Afghanistan (83.2%, a difference of 0.010%).
| Demographics | Rating | Rank | In Labor Force | Age 45-54 |
| Immigrants | Singapore | 93.9 /100 | #102 | Exceptional 83.3% |
| Albanians | 93.9 /100 | #103 | Exceptional 83.3% |
| Immigrants | Romania | 93.8 /100 | #104 | Exceptional 83.3% |
| Immigrants | South America | 93.5 /100 | #105 | Exceptional 83.2% |
| Sri Lankans | 93.2 /100 | #106 | Exceptional 83.2% |
| Iranians | 92.9 /100 | #107 | Exceptional 83.2% |
| Slovaks | 92.8 /100 | #108 | Exceptional 83.2% |
| Ukrainians | 92.7 /100 | #109 | Exceptional 83.2% |
| Immigrants | Africa | 92.6 /100 | #110 | Exceptional 83.2% |
| Immigrants | Italy | 92.5 /100 | #111 | Exceptional 83.2% |
| Immigrants | Afghanistan | 92.4 /100 | #112 | Exceptional 83.2% |
| Immigrants | Albania | 91.8 /100 | #113 | Exceptional 83.2% |
| Assyrians/Chaldeans/Syriacs | 91.7 /100 | #114 | Exceptional 83.2% |
| Immigrants | Chile | 91.6 /100 | #115 | Exceptional 83.2% |
| Immigrants | Malaysia | 91.4 /100 | #116 | Exceptional 83.2% |